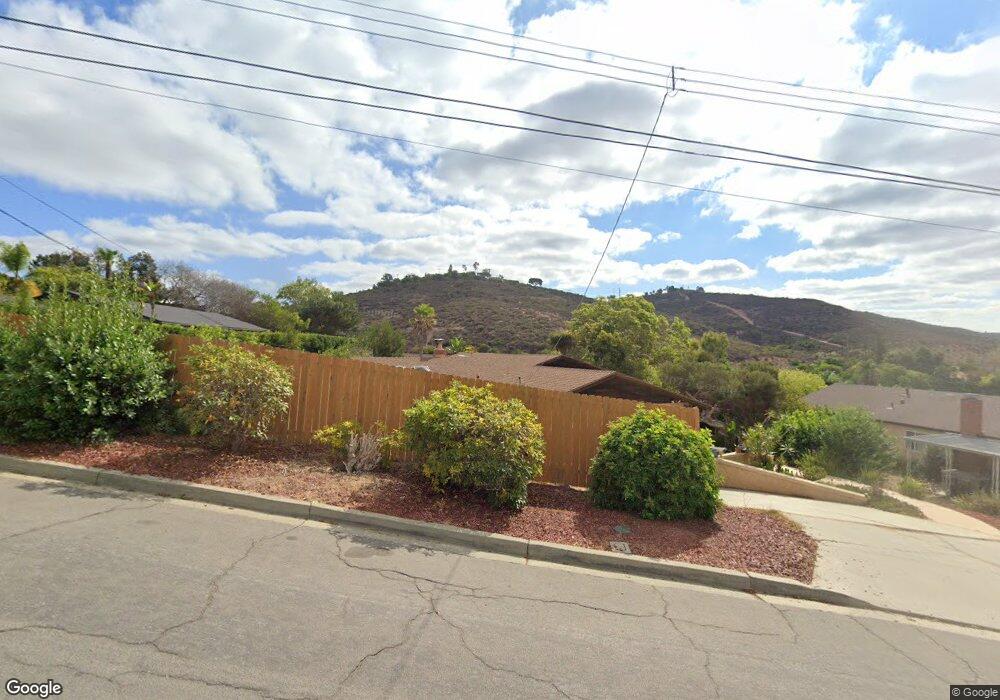
1825 Towhee St San Marcos, CA 92078
Estimated Value: $982,000 - $1,338,686
3
Beds
2
Baths
2,144
Sq Ft
$559/Sq Ft
Est. Value
About This Home
This home is located at 1825 Towhee St, San Marcos, CA 92078 and is currently estimated at $1,198,422, approximately $558 per square foot. 1825 Towhee St is a home located in San Diego County with nearby schools including La Costa Meadows Elementary, San Elijo Middle School, and San Marcos High School.
Ownership History
Date
Name
Owned For
Owner Type
Purchase Details
Closed on
Nov 9, 2023
Sold by
Kibbe Douglas J and Kibbe Lisa
Bought by
Kibbe Family Trust and Kibbe
Current Estimated Value
Purchase Details
Closed on
Dec 16, 1994
Sold by
Emc Mtg Corp
Bought by
Kibbe Douglas J and Hightower Kibbe Lisa
Home Financials for this Owner
Home Financials are based on the most recent Mortgage that was taken out on this home.
Original Mortgage
$144,000
Interest Rate
5.25%
Purchase Details
Closed on
Dec 1, 1993
Sold by
Great Western Bank
Bought by
Emc Mtg Corp
Purchase Details
Closed on
Oct 15, 1993
Sold by
California Reconveyance Company
Bought by
Great Western Bank
Purchase Details
Closed on
May 9, 1990
Purchase Details
Closed on
Aug 31, 1988
Purchase Details
Closed on
Dec 20, 1985
Create a Home Valuation Report for This Property
The Home Valuation Report is an in-depth analysis detailing your home's value as well as a comparison with similar homes in the area
Home Values in the Area
Average Home Value in this Area
Purchase History
| Date | Buyer | Sale Price | Title Company |
|---|---|---|---|
| Kibbe Family Trust | -- | None Listed On Document | |
| Kibbe Douglas J | $160,000 | Fidelity National Title | |
| Emc Mtg Corp | -- | -- | |
| Great Western Bank | $127,564 | Chicago Title | |
| -- | $239,000 | -- | |
| -- | $178,900 | -- | |
| -- | $142,500 | -- |
Source: Public Records
Mortgage History
| Date | Status | Borrower | Loan Amount |
|---|---|---|---|
| Previous Owner | Kibbe Douglas J | $144,000 |
Source: Public Records
Tax History Compared to Growth
Tax History
| Year | Tax Paid | Tax Assessment Tax Assessment Total Assessment is a certain percentage of the fair market value that is determined by local assessors to be the total taxable value of land and additions on the property. | Land | Improvement |
|---|---|---|---|---|
| 2025 | $3,229 | $302,317 | $109,165 | $193,152 |
| 2024 | $3,229 | $296,390 | $107,025 | $189,365 |
| 2023 | $3,167 | $290,579 | $104,927 | $185,652 |
| 2022 | $3,123 | $284,882 | $102,870 | $182,012 |
| 2021 | $3,070 | $279,297 | $100,853 | $178,444 |
| 2020 | $3,040 | $276,434 | $99,819 | $176,615 |
| 2019 | $3,005 | $271,014 | $97,862 | $173,152 |
| 2018 | $2,908 | $265,701 | $95,944 | $169,757 |
| 2017 | $761 | $260,492 | $94,063 | $166,429 |
| 2016 | $2,804 | $255,385 | $92,219 | $163,166 |
| 2015 | $2,763 | $251,550 | $90,834 | $160,716 |
| 2014 | $2,699 | $246,623 | $89,055 | $157,568 |
Source: Public Records
Map
Nearby Homes
- 6691 Corte Eduardo
- 3090 Via Maximo
- 6789 Camino de Amigos
- 3137 Avenida Topanga
- 3149 Avenida Olmeda
- 6448 Terraza Portico
- 6581 Camino Capistrano
- 3430 Corte Viejo
- 6759 Paseo Del Vista
- 2930 Rancho Cortes
- 2533 Antlers Way
- 1710 Via Allondra
- 2513 Antlers Way
- 6267 Via Trato
- 3230 Corte Aliso
- 2194 Coast Ave
- 3414 Filoli Cir
- 3430 Filoli Cir
- 2153 Goya Place
- 2875 Rancho Cortes
- 1819 Towhee St
- 1831 Towhee St
- 1830 Redwing St
- 1719 Kinglet Rd
- 1813 Towhee St
- 1828 Towhee St
- 1824 Towhee St
- 1826 Redwing St
- 1832 Towhee St
- 1807 Towhee St
- 1820 Towhee St
- 1716 Kinglet Rd
- 1710 Kinglet Rd
- 1816 Towhee St
- 1822 Redwing St
- 1704 Kinglet Rd
- 1720 Kinglet Rd
- 1812 Towhee St
- 1727 Kinglet Rd
- 1700 Kinglet Rd