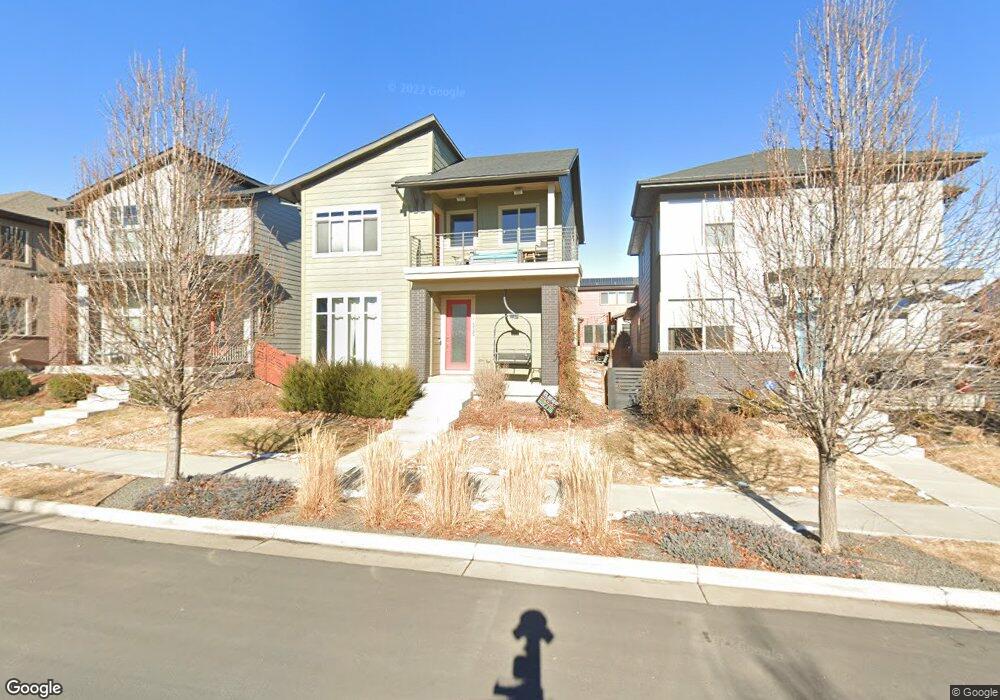
1825 W 67th Ave Denver, CO 80221
Twin Lakes NeighborhoodEstimated Value: $801,000 - $830,000
4
Beds
4
Baths
3,318
Sq Ft
$246/Sq Ft
Est. Value
About This Home
This home is located at 1825 W 67th Ave, Denver, CO 80221 and is currently estimated at $815,236, approximately $245 per square foot. 1825 W 67th Ave is a home located in Adams County with nearby schools including Trailside Academy and Midtown Montessori Academy.
Ownership History
Date
Name
Owned For
Owner Type
Purchase Details
Closed on
Dec 10, 2019
Sold by
Martinet Joseph A
Bought by
Rebellato Annette M
Current Estimated Value
Home Financials for this Owner
Home Financials are based on the most recent Mortgage that was taken out on this home.
Original Mortgage
$451,375
Outstanding Balance
$397,952
Interest Rate
3.6%
Mortgage Type
New Conventional
Estimated Equity
$417,284
Purchase Details
Closed on
Apr 30, 2018
Sold by
Zemmelman Matthew L and Zemmelman Michelle E
Bought by
Martinet Joseph A and Rebellato Annette M
Home Financials for this Owner
Home Financials are based on the most recent Mortgage that was taken out on this home.
Original Mortgage
$453,100
Interest Rate
4.44%
Mortgage Type
New Conventional
Purchase Details
Closed on
Apr 7, 2014
Sold by
Weekley Homes Llc
Bought by
Zemmelman Matthew L and Zemmelman Michelle E
Home Financials for this Owner
Home Financials are based on the most recent Mortgage that was taken out on this home.
Original Mortgage
$451,650
Interest Rate
4.41%
Mortgage Type
VA
Create a Home Valuation Report for This Property
The Home Valuation Report is an in-depth analysis detailing your home's value as well as a comparison with similar homes in the area
Home Values in the Area
Average Home Value in this Area
Purchase History
| Date | Buyer | Sale Price | Title Company |
|---|---|---|---|
| Rebellato Annette M | -- | Assured Title Agency | |
| Martinet Joseph A | $569,000 | Land Title Guarantee | |
| Zemmelman Matthew L | $443,991 | Fidelity National Title Ins |
Source: Public Records
Mortgage History
| Date | Status | Borrower | Loan Amount |
|---|---|---|---|
| Open | Rebellato Annette M | $451,375 | |
| Previous Owner | Martinet Joseph A | $453,100 | |
| Previous Owner | Zemmelman Matthew L | $451,650 |
Source: Public Records
Tax History Compared to Growth
Tax History
| Year | Tax Paid | Tax Assessment Tax Assessment Total Assessment is a certain percentage of the fair market value that is determined by local assessors to be the total taxable value of land and additions on the property. | Land | Improvement |
|---|---|---|---|---|
| 2024 | $8,138 | $50,750 | $9,250 | $41,500 |
| 2023 | $8,104 | $56,360 | $9,000 | $47,360 |
| 2022 | $7,437 | $43,210 | $9,240 | $33,970 |
| 2021 | $7,165 | $43,210 | $9,240 | $33,970 |
| 2020 | $6,431 | $39,450 | $9,510 | $29,940 |
| 2019 | $6,441 | $39,450 | $9,510 | $29,940 |
| 2018 | $5,803 | $34,150 | $6,260 | $27,890 |
| 2017 | $5,700 | $34,150 | $6,260 | $27,890 |
| 2016 | $5,611 | $33,810 | $6,370 | $27,440 |
| 2015 | $5,187 | $33,810 | $6,370 | $27,440 |
| 2014 | $1,701 | $10,740 | $3,980 | $6,760 |
Source: Public Records
Map
Nearby Homes
- 1813 W 67th Ave
- 6721 Alan Dr
- 6747 Raritan Dr
- 6735 Avrum Dr
- 1903 W 66th Ave
- 1848 W 68th Ave
- 1641 W 67th Cir
- 1571 W 68th Ln
- 1575 W 68th Ave
- 6632 Osage St
- 1435 W 67th Ave
- 6757 Warren Dr
- 1465 W 68th Ave
- 6791 Navajo Ct
- 6799 Navajo St
- 6783 Morrison Dr
- 6784 Navajo St
- 6673 Fern Dr
- 1340 W 68th Ave
- 2568 W 68th Ave