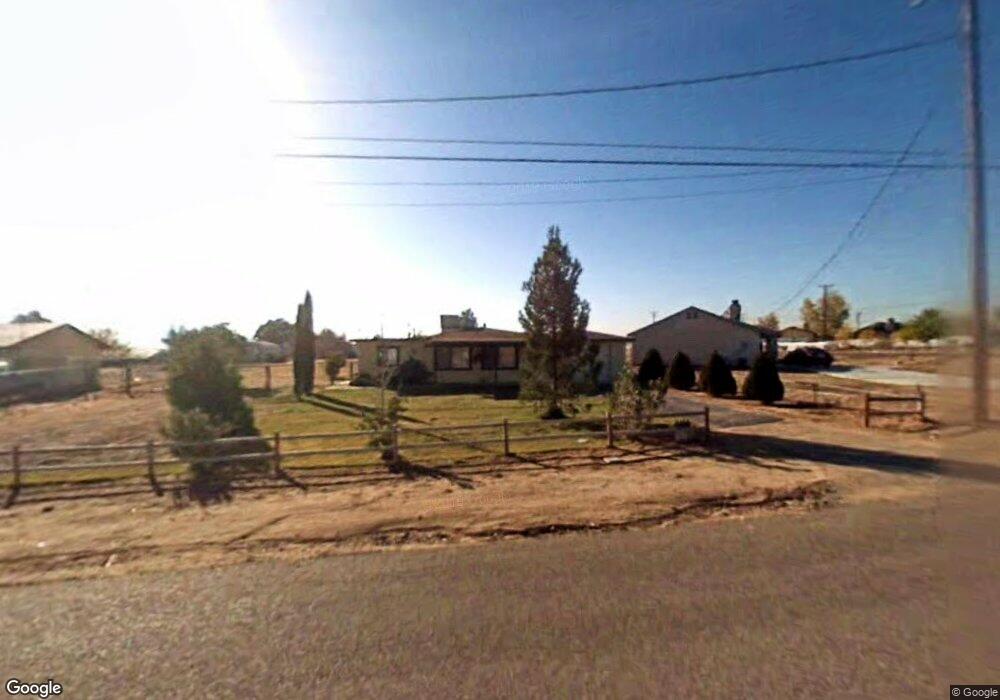
18255 Hackberry St Hesperia, CA 92345
Hesperia Palisades NeighborhoodEstimated Value: $340,000 - $407,000
3
Beds
1
Bath
1,278
Sq Ft
$293/Sq Ft
Est. Value
About This Home
This home is located at 18255 Hackberry St, Hesperia, CA 92345 and is currently estimated at $374,183, approximately $292 per square foot. 18255 Hackberry St is a home located in San Bernardino County with nearby schools including Carmel Elementary School, Ranchero Middle School, and Sultana High School.
Ownership History
Date
Name
Owned For
Owner Type
Purchase Details
Closed on
Sep 4, 2024
Sold by
Hughes Valerie A
Bought by
Valerie A Hughes Revocable Living Trust and Hughes
Current Estimated Value
Purchase Details
Closed on
Mar 7, 2003
Sold by
Deermer Brian C
Bought by
Hughes Valerie A
Home Financials for this Owner
Home Financials are based on the most recent Mortgage that was taken out on this home.
Original Mortgage
$88,609
Interest Rate
5.71%
Mortgage Type
FHA
Purchase Details
Closed on
Jul 28, 1998
Sold by
Countrywide Home Loans Inc
Bought by
Deermer Brian C
Home Financials for this Owner
Home Financials are based on the most recent Mortgage that was taken out on this home.
Original Mortgage
$32,926
Interest Rate
6.95%
Mortgage Type
FHA
Purchase Details
Closed on
Apr 23, 1998
Sold by
Smith James W and Smith Vicky K
Bought by
Countrywide Home Loans Inc
Create a Home Valuation Report for This Property
The Home Valuation Report is an in-depth analysis detailing your home's value as well as a comparison with similar homes in the area
Home Values in the Area
Average Home Value in this Area
Purchase History
| Date | Buyer | Sale Price | Title Company |
|---|---|---|---|
| Valerie A Hughes Revocable Living Trust | -- | None Listed On Document | |
| Hughes Valerie A | $90,000 | Chicago Title Co | |
| Deermer Brian C | $32,000 | Landsafe Title | |
| Countrywide Home Loans Inc | $34,900 | Landsafe Title |
Source: Public Records
Mortgage History
| Date | Status | Borrower | Loan Amount |
|---|---|---|---|
| Previous Owner | Hughes Valerie A | $88,609 | |
| Previous Owner | Deermer Brian C | $32,926 | |
| Closed | Hughes Valerie A | $2,700 |
Source: Public Records
Tax History
| Year | Tax Paid | Tax Assessment Tax Assessment Total Assessment is a certain percentage of the fair market value that is determined by local assessors to be the total taxable value of land and additions on the property. | Land | Improvement |
|---|---|---|---|---|
| 2025 | $1,521 | $138,823 | $26,069 | $112,754 |
| 2024 | $1,486 | $136,101 | $25,558 | $110,543 |
| 2023 | $1,469 | $133,432 | $25,057 | $108,375 |
| 2022 | $1,435 | $130,816 | $24,566 | $106,250 |
| 2021 | $1,408 | $128,251 | $24,084 | $104,167 |
| 2020 | $1,391 | $126,936 | $23,837 | $103,099 |
| 2019 | $1,362 | $124,447 | $23,370 | $101,077 |
| 2018 | $1,335 | $122,007 | $22,912 | $99,095 |
| 2017 | $1,311 | $119,615 | $22,463 | $97,152 |
| 2016 | $1,282 | $117,270 | $22,023 | $95,247 |
| 2015 | $1,266 | $115,508 | $21,692 | $93,816 |
| 2014 | $953 | $86,300 | $17,300 | $69,000 |
Source: Public Records
Map
Nearby Homes
- 0 Jacaranda Unit CV24240940
- 18062 Hackberry St
- 18063 Catalpa St
- 18104 Birch St
- 18021 Birch St
- 11562 Orchid Ave
- 11691 Ivy Ave
- 11598 Peach Ave
- 0 Alder St
- 11742 Jacaranda Ave
- 11843 Ivy Ave
- 17940 Alder St
- 11815 Ivy Ave
- 18089 Capri St
- 18292 Verano St
- 10936 Moreno Ave
- 17820 Sycamore St
- 10872 Peach Ave
- 18441 Verano St
- 0 Catalpa Unit HD25253555
- 18269 Hackberry St
- 18254 Deodar St
- 18283 Hackberry St
- 18268 Deodar St
- 18236 Deodar St
- 18236 Deodar Hesperia
- 18254 Hackberry St
- 18270 Hackberry St
- 18238 Hackberry St
- 18282 Deodar St
- 18301 Hackberry St
- 18284 Hackberry St
- 11356 Jacaranda Ave
- 18203 Hackberry St
- 18220 Hackberry St
- 18302 Hackberry St
- 18323 Hackberry St
- 18204 Deodar St
- 18202 Hackberry St
Your Personal Tour Guide
Ask me questions while you tour the home.