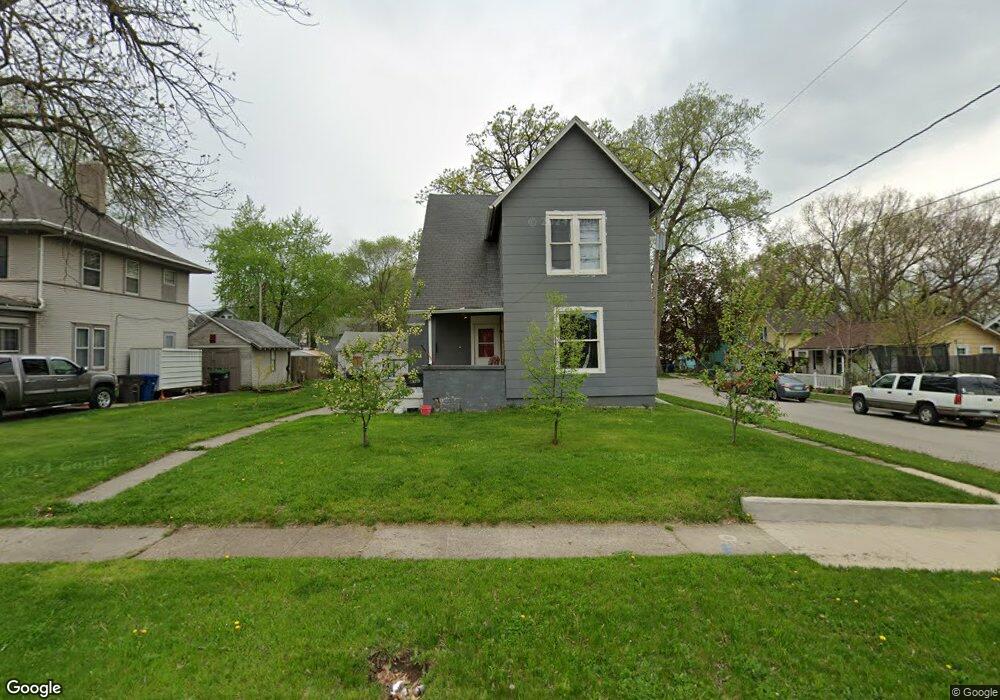
1826 9th St Des Moines, IA 50314
River Bend NeighborhoodEstimated Value: $138,000
2
Beds
2
Baths
1,506
Sq Ft
$92/Sq Ft
Est. Value
About This Home
This home is located at 1826 9th St, Des Moines, IA 50314 and is currently estimated at $138,000, approximately $91 per square foot. 1826 9th St is a home located in Polk County with nearby schools including Moulton Elementary School, Harding Middle School, and North High School.
Ownership History
Date
Name
Owned For
Owner Type
Purchase Details
Closed on
Oct 22, 2015
Sold by
Auduril Llc
Bought by
Kelley Edward L
Current Estimated Value
Purchase Details
Closed on
Nov 4, 2013
Sold by
Kim Brian H
Bought by
Anduril Llc
Purchase Details
Closed on
Dec 12, 2012
Sold by
Grinnell State Bank
Bought by
Kim Brian H
Purchase Details
Closed on
Apr 25, 2012
Sold by
Newman Clifford A and Newman Gabriella Mammana
Bought by
Grinnell State Bank
Purchase Details
Closed on
Feb 24, 2011
Sold by
Newman Clifford Allen
Bought by
Newman Clifford Allen and Newman Gabriella Mammana
Purchase Details
Closed on
Dec 10, 2009
Sold by
Otte Sharon Rose
Bought by
Newman Clifford A
Purchase Details
Closed on
Apr 1, 1998
Sold by
Mccormick Ronald and Mccormick Donna
Bought by
Newman Clifford A and Otte Sharon R
Home Financials for this Owner
Home Financials are based on the most recent Mortgage that was taken out on this home.
Original Mortgage
$40,000
Interest Rate
7.09%
Mortgage Type
Commercial
Create a Home Valuation Report for This Property
The Home Valuation Report is an in-depth analysis detailing your home's value as well as a comparison with similar homes in the area
Home Values in the Area
Average Home Value in this Area
Purchase History
| Date | Buyer | Sale Price | Title Company |
|---|---|---|---|
| Kelley Edward L | $13,500 | None Available | |
| Anduril Llc | -- | None Available | |
| Kim Brian H | -- | None Available | |
| Grinnell State Bank | -- | None Available | |
| Newman Clifford Allen | -- | None Available | |
| Newman Clifford A | -- | None Available | |
| Newman Clifford A | $35,000 | -- |
Source: Public Records
Mortgage History
| Date | Status | Borrower | Loan Amount |
|---|---|---|---|
| Previous Owner | Newman Clifford A | $40,000 |
Source: Public Records
Tax History
| Year | Tax Paid | Tax Assessment Tax Assessment Total Assessment is a certain percentage of the fair market value that is determined by local assessors to be the total taxable value of land and additions on the property. | Land | Improvement |
|---|---|---|---|---|
| 2025 | $1,488 | $88,200 | $14,700 | $73,500 |
| 2024 | $1,488 | $75,600 | $12,600 | $63,000 |
| 2023 | $1,290 | $75,600 | $12,600 | $63,000 |
| 2022 | $1,280 | $54,700 | $9,500 | $45,200 |
| 2021 | $1,210 | $54,700 | $9,500 | $45,200 |
| 2020 | $1,258 | $48,500 | $8,500 | $40,000 |
| 2019 | $760 | $48,500 | $8,500 | $40,000 |
| 2018 | $752 | $28,300 | $7,600 | $20,700 |
| 2017 | $1,338 | $28,300 | $7,600 | $20,700 |
| 2016 | $1,304 | $49,500 | $7,600 | $41,900 |
| 2015 | $1,304 | $49,500 | $7,600 | $41,900 |
| 2014 | $1,216 | $47,500 | $8,000 | $39,500 |
Source: Public Records
Map
Nearby Homes
Your Personal Tour Guide
Ask me questions while you tour the home.