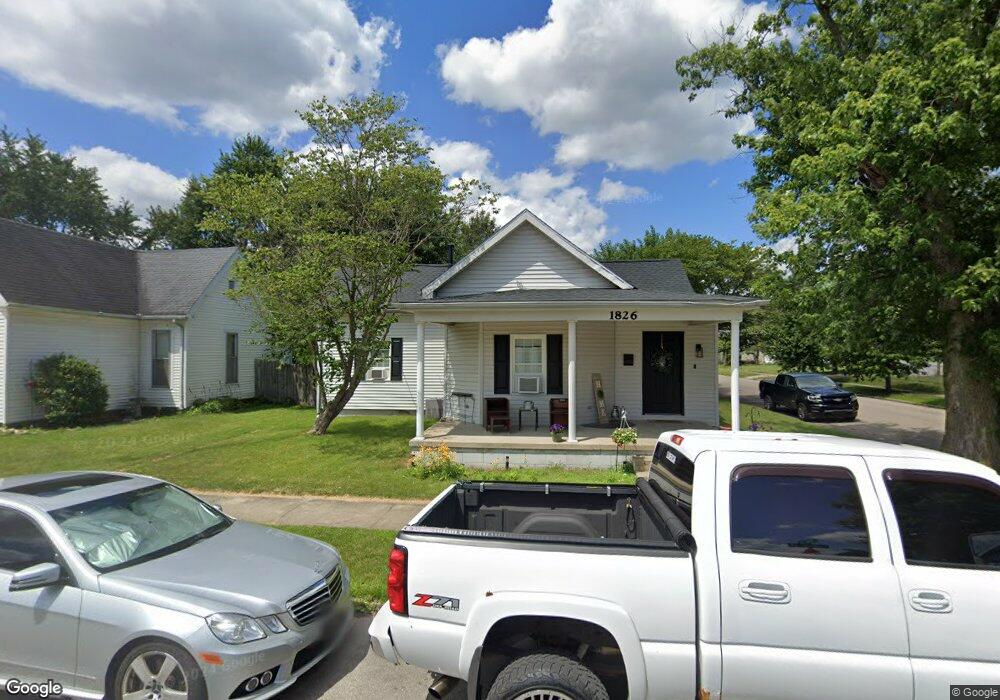
1826 Gilmore St Columbus, IN 47201
Estimated Value: $122,000 - $228,000
2
Beds
2
Baths
1,200
Sq Ft
$160/Sq Ft
Est. Value
About This Home
This home is located at 1826 Gilmore St, Columbus, IN 47201 and is currently estimated at $191,755, approximately $159 per square foot. 1826 Gilmore St is a home located in Bartholomew County with nearby schools including Lillian Schmitt Elementary School, Northside Middle School, and Columbus North High School.
Ownership History
Date
Name
Owned For
Owner Type
Purchase Details
Closed on
Nov 6, 2023
Sold by
Dixon Virginia
Bought by
Staker Jerrin Alan
Current Estimated Value
Purchase Details
Closed on
Jun 29, 2022
Sold by
Mccolley Grace
Bought by
Dixon Virginia
Purchase Details
Closed on
Apr 29, 2011
Sold by
Not Provided
Bought by
Meredith Grace
Purchase Details
Closed on
Apr 26, 2011
Sold by
The Sec Of Hud
Bought by
Meredith Grace
Purchase Details
Closed on
Oct 4, 2010
Sold by
Bac Home Loans Servicing L P
Bought by
Sec Of Housing & Urban Development
Purchase Details
Closed on
Jun 8, 2010
Sold by
Gorbett Sheriff Mark
Bought by
Bac Home Loans Servicing Lp
Purchase Details
Closed on
Sep 22, 2003
Sold by
Charles Bower
Bought by
Knulf Kelly M and Knulf Dean A
Purchase Details
Closed on
Apr 30, 1998
Sold by
Brenda Hawkins
Bought by
Bower Charles and Bower Georgia
Create a Home Valuation Report for This Property
The Home Valuation Report is an in-depth analysis detailing your home's value as well as a comparison with similar homes in the area
Home Values in the Area
Average Home Value in this Area
Purchase History
| Date | Buyer | Sale Price | Title Company |
|---|---|---|---|
| Staker Jerrin Alan | $141,000 | Cfs Title Llc | |
| Dixon Virginia | $83,000 | Meridian Title Corporation | |
| Meredith Grace | $69,700 | -- | |
| Meredith Grace | $69,700 | -- | |
| Sec Of Housing & Urban Development | $108,379 | -- | |
| Bac Home Loans Servicing Lp | $108,380 | -- | |
| Knulf Kelly M | $97,000 | -- | |
| Bower Charles | $87,000 | -- |
Source: Public Records
Tax History Compared to Growth
Tax History
| Year | Tax Paid | Tax Assessment Tax Assessment Total Assessment is a certain percentage of the fair market value that is determined by local assessors to be the total taxable value of land and additions on the property. | Land | Improvement |
|---|---|---|---|---|
| 2024 | $1,653 | $152,000 | $35,000 | $117,000 |
| 2023 | $998 | $111,500 | $35,000 | $76,500 |
| 2022 | $1,033 | $110,700 | $35,000 | $75,700 |
| 2021 | $1,055 | $142,200 | $18,600 | $123,600 |
| 2020 | $1,274 | $121,500 | $18,600 | $102,900 |
| 2019 | $1,081 | $114,700 | $18,600 | $96,100 |
| 2018 | $1,025 | $111,800 | $18,600 | $93,200 |
| 2017 | $974 | $108,200 | $18,600 | $89,600 |
| 2016 | $956 | $108,400 | $18,600 | $89,800 |
| 2014 | $954 | $106,700 | $18,600 | $88,100 |
Source: Public Records
Map
Nearby Homes
- 1816 Gilmore St
- 1902 Gilmore St
- 1810 Gilmore St
- 1827 Newton St
- 1910 Gilmore St
- 1825 Newton St
- 1802 Gilmore St
- 1903 Newton St
- 1827 Gilmore St
- 1805 Newton St
- 1817 Gilmore St
- 1901 Gilmore St
- 1918 Gilmore St
- 1809 Gilmore St
- 1909 Newton St
- 1803 Newton St
- 1907 Gilmore St
- 1803 Gilmore St
- 1728 Gilmore St
- 1922 Gilmore St