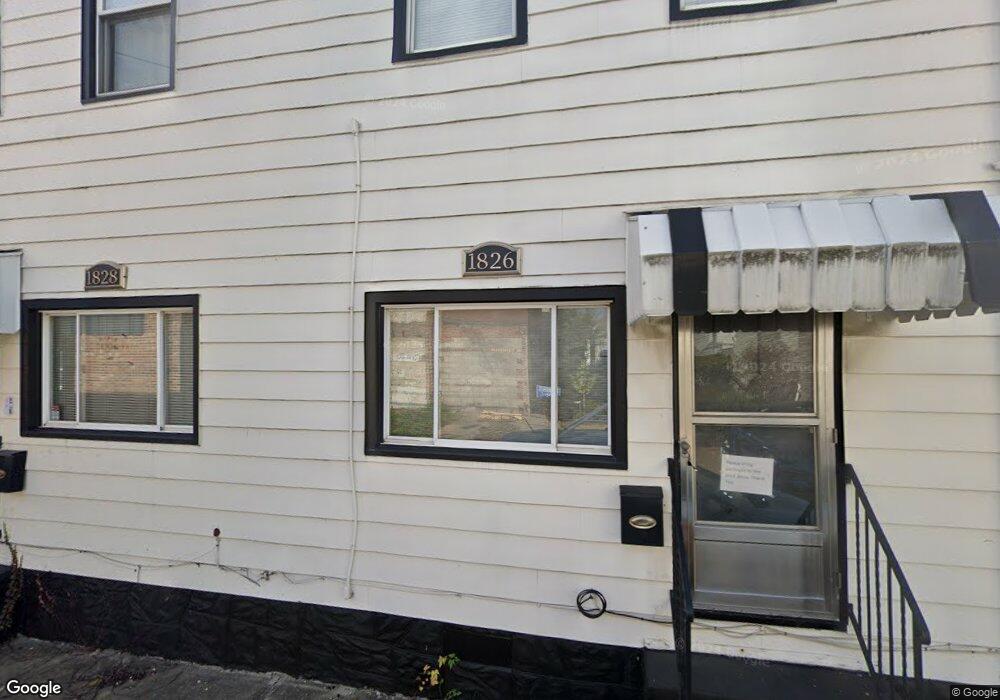
1826 Larkins Way Pittsburgh, PA 15203
Southside Flats NeighborhoodEstimated Value: $317,000 - $375,000
4
Beds
2
Baths
2,151
Sq Ft
$159/Sq Ft
Est. Value
About This Home
This home is located at 1826 Larkins Way, Pittsburgh, PA 15203 and is currently estimated at $341,000, approximately $158 per square foot. 1826 Larkins Way is a home located in Allegheny County with nearby schools including Pittsburgh Phillips K-5 Elementary School, South Hills Middle School, and Pittsburgh Brashear High School.
Ownership History
Date
Name
Owned For
Owner Type
Purchase Details
Closed on
Apr 8, 2021
Sold by
Andreen Mark R
Bought by
George William Group Llc
Current Estimated Value
Home Financials for this Owner
Home Financials are based on the most recent Mortgage that was taken out on this home.
Original Mortgage
$600,000
Outstanding Balance
$540,853
Interest Rate
2.9%
Mortgage Type
Closed End Mortgage
Estimated Equity
-$199,853
Purchase Details
Closed on
May 29, 2014
Sold by
Ciotti Trste Petronella V
Bought by
Andreen Mark R
Home Financials for this Owner
Home Financials are based on the most recent Mortgage that was taken out on this home.
Original Mortgage
$144,375
Interest Rate
4.26%
Mortgage Type
New Conventional
Create a Home Valuation Report for This Property
The Home Valuation Report is an in-depth analysis detailing your home's value as well as a comparison with similar homes in the area
Home Values in the Area
Average Home Value in this Area
Purchase History
| Date | Buyer | Sale Price | Title Company |
|---|---|---|---|
| George William Group Llc | -- | -- | |
| George William Group Llc | $183,540 | Brokers Settlement Services | |
| Andreen Mark R | $192,500 | -- |
Source: Public Records
Mortgage History
| Date | Status | Borrower | Loan Amount |
|---|---|---|---|
| Open | George William Group Llc | $600,000 | |
| Previous Owner | Andreen Mark R | $144,375 |
Source: Public Records
Tax History Compared to Growth
Tax History
| Year | Tax Paid | Tax Assessment Tax Assessment Total Assessment is a certain percentage of the fair market value that is determined by local assessors to be the total taxable value of land and additions on the property. | Land | Improvement |
|---|---|---|---|---|
| 2025 | $3,686 | $160,000 | $31,000 | $129,000 |
| 2024 | $3,686 | $160,000 | $31,000 | $129,000 |
| 2023 | $3,686 | $160,000 | $31,000 | $129,000 |
| 2022 | $3,638 | $160,000 | $31,000 | $129,000 |
| 2021 | $3,638 | $160,000 | $31,000 | $129,000 |
| 2020 | $3,621 | $160,000 | $31,000 | $129,000 |
| 2019 | $3,621 | $160,000 | $31,000 | $129,000 |
| 2018 | $2,904 | $160,000 | $31,000 | $129,000 |
| 2017 | $3,621 | $160,000 | $31,000 | $129,000 |
| 2016 | $757 | $160,000 | $31,000 | $129,000 |
| 2015 | $757 | $160,000 | $31,000 | $129,000 |
| 2014 | $3,541 | $142,000 | $31,000 | $111,000 |
Source: Public Records
Map
Nearby Homes