Estimated Value: $863,000 - $922,000
3
Beds
2
Baths
1,511
Sq Ft
$589/Sq Ft
Est. Value
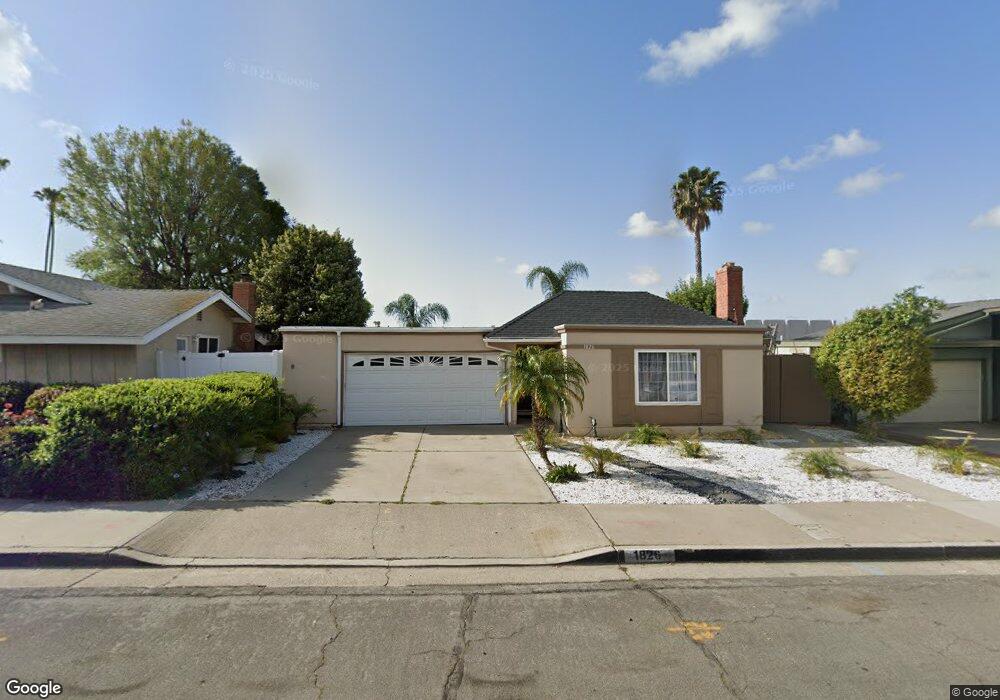
About This Home
This home is located at 1826 Skywood St, Brea, CA 92821 and is currently estimated at $890,468, approximately $589 per square foot. 1826 Skywood St is a home located in Orange County with nearby schools including Sierra Vista Elementary School, Ladera Palma Elementary School, and Washington Middle School.
Ownership History
Date
Name
Owned For
Owner Type
Purchase Details
Closed on
Dec 14, 1998
Sold by
Mateus Cynthia J
Bought by
Rubalcava Juan M and Rubalcava Ruth M
Current Estimated Value
Home Financials for this Owner
Home Financials are based on the most recent Mortgage that was taken out on this home.
Original Mortgage
$146,025
Outstanding Balance
$33,026
Interest Rate
6.73%
Mortgage Type
Stand Alone First
Estimated Equity
$857,442
Purchase Details
Closed on
Feb 7, 1997
Sold by
Federal Home Loan Mortgage Corporation
Bought by
Mateus Cynthia J
Home Financials for this Owner
Home Financials are based on the most recent Mortgage that was taken out on this home.
Original Mortgage
$128,500
Interest Rate
7.85%
Purchase Details
Closed on
Jul 19, 1996
Sold by
Elders John L and Elders Michele L
Bought by
Orco State Employees Fcu
Purchase Details
Closed on
Jul 5, 1996
Sold by
Orco State Employees Fcu
Bought by
Federal Home Loan Mortgage Corporation
Create a Home Valuation Report for This Property
The Home Valuation Report is an in-depth analysis detailing your home's value as well as a comparison with similar homes in the area
Home Values in the Area
Average Home Value in this Area
Purchase History
| Date | Buyer | Sale Price | Title Company |
|---|---|---|---|
| Rubalcava Juan M | $195,000 | Chicago Title | |
| Mateus Cynthia J | $148,500 | Orange Coast Title | |
| Orco State Employees Fcu | $153,000 | American Title Ins Co | |
| Federal Home Loan Mortgage Corporation | -- | American Title Ins Co |
Source: Public Records
Mortgage History
| Date | Status | Borrower | Loan Amount |
|---|---|---|---|
| Open | Rubalcava Juan M | $146,025 | |
| Previous Owner | Mateus Cynthia J | $128,500 | |
| Closed | Rubalcava Juan M | $29,205 |
Source: Public Records
Tax History Compared to Growth
Tax History
| Year | Tax Paid | Tax Assessment Tax Assessment Total Assessment is a certain percentage of the fair market value that is determined by local assessors to be the total taxable value of land and additions on the property. | Land | Improvement |
|---|---|---|---|---|
| 2025 | $3,698 | $305,222 | $191,706 | $113,516 |
| 2024 | $3,698 | $299,238 | $187,947 | $111,291 |
| 2023 | $3,611 | $293,371 | $184,262 | $109,109 |
| 2022 | $3,568 | $287,619 | $180,649 | $106,970 |
| 2021 | $3,509 | $281,980 | $177,107 | $104,873 |
| 2020 | $3,475 | $279,089 | $175,291 | $103,798 |
| 2019 | $3,382 | $273,617 | $171,854 | $101,763 |
| 2018 | $3,324 | $268,252 | $168,484 | $99,768 |
| 2017 | $3,264 | $262,993 | $165,181 | $97,812 |
| 2016 | $3,187 | $257,837 | $161,942 | $95,895 |
| 2015 | $3,098 | $253,965 | $159,510 | $94,455 |
| 2014 | $3,007 | $248,991 | $156,386 | $92,605 |
Source: Public Records
Map
Nearby Homes
- 1682 Ironwood Ct
- 1663 Gatewood Ct
- 2121 Lake Side Dr Unit 158
- 598 Elkwood Ct
- 620 Lake Ridge Way Unit 45
- 2201 Lake View Dr Unit 20
- 551 Lake Grove Way Unit 165
- 1506 Bergman Ct
- 2300 Lake Forest Cir Unit 113
- 1400 Eastpark Dr
- 1341 Harbor Lake Ave Unit 24
- 1414 W Central Ave Unit 88
- 1508 Mccart Ave
- 685 View Lake Cir Unit 161
- 1256 Harbor Lake Ave
- 1251 Sky Lake Ave Unit 330
- 755 Village Lake Mall Unit 337
- 521 Forest Lake Dr Unit 64
- 746 Village Lake Mall Unit 334
- 1018 E La Habra Blvd Unit 238
- 1836 Skywood St
- 1818 Skywood St
- 1844 Skywood St
- 1808 Skywood St
- 1825 Skywood St
- 1854 Skywood St
- 1800 Skywood St
- 1845 Skywood St
- 710 Sonora St
- 1855 Skywood St
- 1862 Skywood St
- 1822 Lotus Place
- 1832 Lotus Place
- 720 Sonora St
- 1842 Lotus Place
- 1865 Skywood St
- 1872 Skywood St
- 1852 Lotus Place
- 732 Sonora St
- 1862 Lotus Place