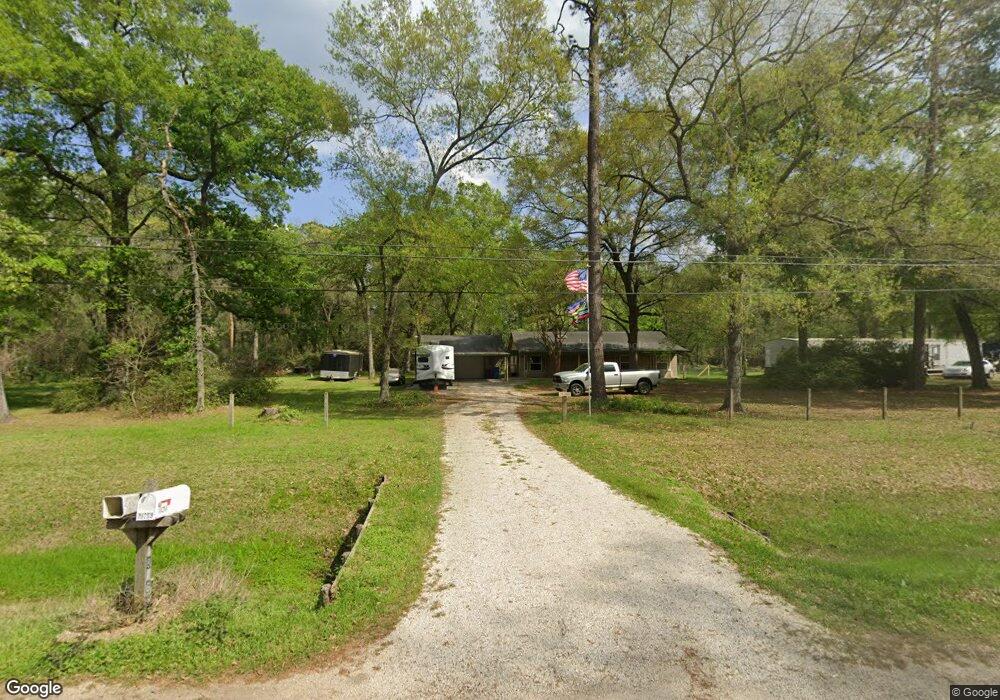
18260 Split Oak Cir Unit 77 New Caney, TX 77357
Estimated Value: $286,000 - $352,000
3
Beds
2
Baths
1,880
Sq Ft
$174/Sq Ft
Est. Value
About This Home
This home is located at 18260 Split Oak Cir Unit 77, New Caney, TX 77357 and is currently estimated at $327,191, approximately $174 per square foot. 18260 Split Oak Cir Unit 77 is a home located in Montgomery County with nearby schools including Milam Elementary School, Grangerland Intermediate School, and Moorhead Junior High School.
Ownership History
Date
Name
Owned For
Owner Type
Purchase Details
Closed on
Oct 21, 2022
Sold by
Yargo Edmond E
Bought by
Gygi Chad A and Gygi Veronica
Current Estimated Value
Home Financials for this Owner
Home Financials are based on the most recent Mortgage that was taken out on this home.
Original Mortgage
$300,000
Outstanding Balance
$288,385
Interest Rate
5.89%
Mortgage Type
VA
Estimated Equity
$38,806
Purchase Details
Closed on
Dec 17, 2003
Sold by
Mccutchen Michael L and Mccutchen Rose L
Bought by
Yargo Edmond E and Yargo Patricia
Home Financials for this Owner
Home Financials are based on the most recent Mortgage that was taken out on this home.
Original Mortgage
$89,900
Interest Rate
5.84%
Mortgage Type
Purchase Money Mortgage
Create a Home Valuation Report for This Property
The Home Valuation Report is an in-depth analysis detailing your home's value as well as a comparison with similar homes in the area
Purchase History
| Date | Buyer | Sale Price | Title Company |
|---|---|---|---|
| Gygi Chad A | -- | First American Title | |
| Yargo Edmond E | -- | Fidelity National Title |
Source: Public Records
Mortgage History
| Date | Status | Borrower | Loan Amount |
|---|---|---|---|
| Open | Gygi Chad A | $300,000 | |
| Previous Owner | Yargo Edmond E | $89,900 |
Source: Public Records
Tax History
| Year | Tax Paid | Tax Assessment Tax Assessment Total Assessment is a certain percentage of the fair market value that is determined by local assessors to be the total taxable value of land and additions on the property. | Land | Improvement |
|---|---|---|---|---|
| 2025 | -- | $365,783 | $40,422 | $325,361 |
| 2024 | $3,474 | $342,386 | -- | -- |
| 2023 | $3,474 | $311,260 | $40,420 | $270,840 |
| 2022 | $3,392 | $195,270 | $40,420 | $185,450 |
| 2021 | $3,282 | $177,520 | $40,420 | $139,810 |
| 2020 | $3,138 | $161,380 | $40,420 | $136,500 |
| 2019 | $2,955 | $146,710 | $40,420 | $126,910 |
| 2018 | $1,870 | $115,000 | $10,110 | $104,890 |
| 2017 | $2,232 | $110,420 | $10,110 | $104,890 |
| 2016 | $2,029 | $100,380 | $10,110 | $113,560 |
| 2015 | $1,490 | $91,250 | $10,110 | $104,690 |
| 2014 | $1,490 | $82,950 | $10,110 | $72,840 |
Source: Public Records
Map
Nearby Homes
- 17858 Split Oak Cir
- 18380 Arbor Oaks Cir
- 17986 Split Oak Cir
- 20089 Split Oak Dr
- 19962 Lowe Ln
- 19934 Lowe
- 19875 Crystalwood Estates Dr
- 19874 Crystalwood Estates Dr
- 0 Emerald Forest Dr
- 17363 Fm 1485 Rd
- 17078 Oak Grove Ln
- 00 Lilac Ln
- 17866 Magnolia Ln
- 19506 Rosali Meadow Dr
- 18403 Tenaha Mill Dr
- 17831 Magnolia Ln
- 18533 Fm 1485 Rd
- 17106 Pickering Rd
- 19352 Acorn Hill Dr
- 19431 Acorn Hill Dr
- 18260 Split Oak Cir
- 18248 Split Oak Cir
- 0 Split Oak Cir
- 18282 Split Oak Cir
- 18220 Split Oak Cir
- 18257 Split Oak Cir
- 18340 Split Oak Cir
- 18532 Arbor Oaks Cir
- 18243 Split Oak Cir
- 18366 Split Oak Cir
- 18293 Split Oak Cir
- 20260 Split Oak Dr
- 18487 Arbor Oaks Cir
- 18186 Split Oak Cir
- 18183 Split Oak Dr
- 20344 Split Oak Dr
- 18520 Arbor Oaks Cir
- 17893 Split Oak Cir
- 17985 Split Oak Cir
- 18554 Arbor Oaks Cir
Your Personal Tour Guide
Ask me questions while you tour the home.