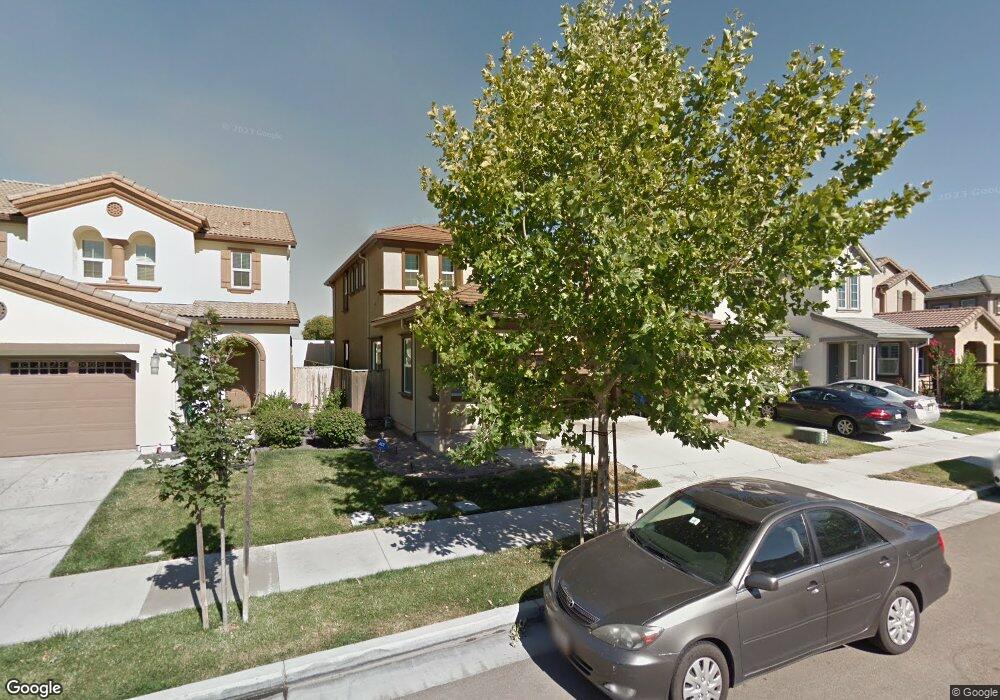
18262 Garmetta Way Lathrop, CA 95330
Estimated Value: $552,000 - $662,000
4
Beds
2
Baths
2,208
Sq Ft
$273/Sq Ft
Est. Value
About This Home
This home is located at 18262 Garmetta Way, Lathrop, CA 95330 and is currently estimated at $603,308, approximately $273 per square foot. 18262 Garmetta Way is a home located in San Joaquin County with nearby schools including Mossdale Elementary School, Lathrop High School, and River Island School of Technology.
Ownership History
Date
Name
Owned For
Owner Type
Purchase Details
Closed on
Dec 30, 2010
Sold by
Fannie Mae
Bought by
Chand Gyan and Chand Suresh
Current Estimated Value
Home Financials for this Owner
Home Financials are based on the most recent Mortgage that was taken out on this home.
Original Mortgage
$189,082
Outstanding Balance
$126,230
Interest Rate
4.35%
Mortgage Type
FHA
Estimated Equity
$477,078
Purchase Details
Closed on
Jul 13, 2010
Sold by
Carroll Christopher and Bohan Rebecca
Bought by
Federal National Mortgage Association
Purchase Details
Closed on
Dec 31, 2007
Sold by
Kb Home Central Valley Inc
Bought by
Carroll Christopher and Bohan Rebecca
Home Financials for this Owner
Home Financials are based on the most recent Mortgage that was taken out on this home.
Original Mortgage
$288,450
Interest Rate
6.05%
Mortgage Type
Purchase Money Mortgage
Create a Home Valuation Report for This Property
The Home Valuation Report is an in-depth analysis detailing your home's value as well as a comparison with similar homes in the area
Home Values in the Area
Average Home Value in this Area
Purchase History
| Date | Buyer | Sale Price | Title Company |
|---|---|---|---|
| Chand Gyan | $194,000 | Old Republic Title Company | |
| Federal National Mortgage Association | $279,719 | Accommodation | |
| Carroll Christopher | $288,500 | First American Title Company |
Source: Public Records
Mortgage History
| Date | Status | Borrower | Loan Amount |
|---|---|---|---|
| Open | Chand Gyan | $189,082 | |
| Previous Owner | Carroll Christopher | $288,450 |
Source: Public Records
Tax History Compared to Growth
Tax History
| Year | Tax Paid | Tax Assessment Tax Assessment Total Assessment is a certain percentage of the fair market value that is determined by local assessors to be the total taxable value of land and additions on the property. | Land | Improvement |
|---|---|---|---|---|
| 2025 | $4,284 | $248,536 | $61,491 | $187,045 |
| 2024 | $4,173 | $243,664 | $60,286 | $183,378 |
| 2023 | $4,054 | $238,887 | $59,104 | $179,783 |
| 2022 | $4,000 | $234,204 | $57,946 | $176,258 |
| 2021 | $3,913 | $229,612 | $56,810 | $172,802 |
| 2020 | $3,791 | $227,259 | $56,228 | $171,031 |
| 2019 | $3,733 | $222,804 | $55,126 | $167,678 |
| 2018 | $3,670 | $218,437 | $54,046 | $164,391 |
| 2017 | $3,609 | $214,155 | $52,987 | $161,168 |
| 2016 | $3,530 | $209,957 | $51,948 | $158,009 |
| 2014 | $3,325 | $202,754 | $50,166 | $152,588 |
Source: Public Records
Map
Nearby Homes
- 18426 Orilla St
- 18447 Orilla St
- 274 Apple Grove Ave
- 18489 Orilla St
- 18482 Orilla St
- Sierra Plan at Eagles Landing
- Muir Plan at Eagles Landing
- Palisade Plan at Eagles Landing
- 18503 Orilla St
- 18517 Orilla St
- 17942 Mckee Blvd
- 17898 Mckee Blvd
- 17879 Farm House Rd
- 17862 Farm House Rd
- Macon II Plan at Mariposa
- Aegean Plan at Mariposa
- 17840 Farm House Rd
- 17806 Mckee Blvd
- 17975 Rusty Plow Ln
- 17709 Mckee Blvd
- 18250 Garmetta Way
- 18274 Garmetta Way
- 18238 Garmetta Way
- 18286 Garmetta Way
- 18226 Garmetta Way
- 18298 Garmetta Way
- 18267 Garmetta Way
- 18253 Garmetta Way
- 215 Garry Oak Place
- 18235 Garmetta Way
- 18218 Garmetta Way
- 18223 Garmetta Way
- 202 Garry Oak Place
- 231 Garry Oak Place
- 18206 Garmetta Way
- 226 Emory Oak Place
- 18246 Schumard Oak Rd
- 218 Garry Oak Place
- 18269 Shumard Oak Rd
- 247 Garry Oak Place