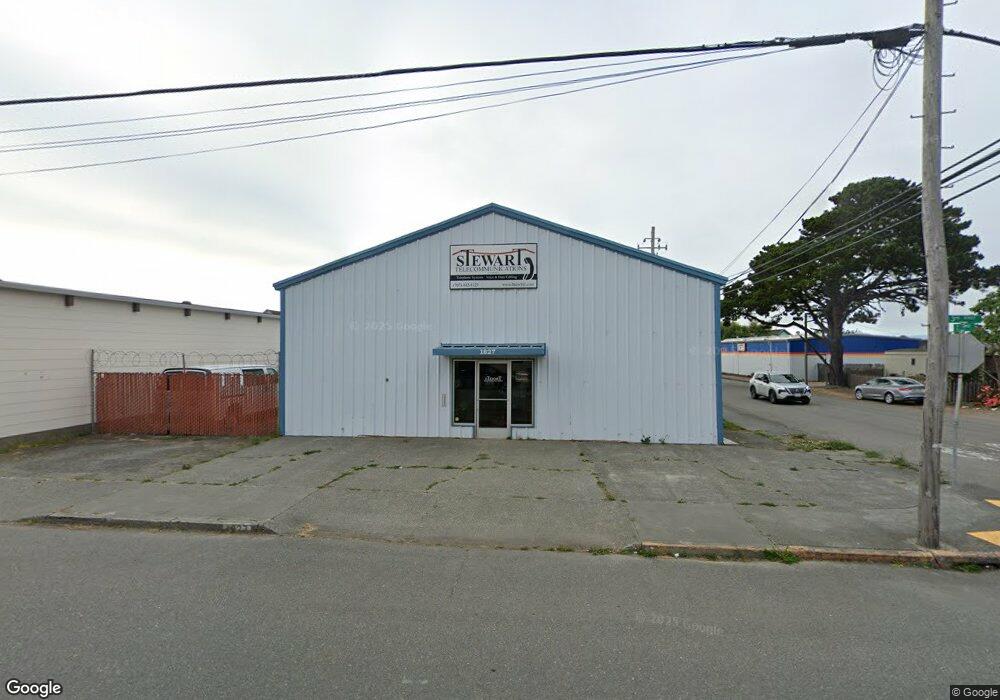
1827 3rd St Eureka, CA 95501
City Center NeighborhoodEstimated Value: $501,864
Studio
2
Baths
2,200
Sq Ft
$228/Sq Ft
Est. Value
About This Home
This home is located at 1827 3rd St, Eureka, CA 95501 and is currently estimated at $501,864, approximately $228 per square foot. 1827 3rd St is a home located in Humboldt County with nearby schools including Lafayette Elementary School, Catherine L. Zane Middle School, and Eureka Senior High School.
Ownership History
Date
Name
Owned For
Owner Type
Purchase Details
Closed on
Dec 31, 2018
Sold by
Stewart Robert C
Bought by
Lafferty Steven J and Baker Sari A
Current Estimated Value
Home Financials for this Owner
Home Financials are based on the most recent Mortgage that was taken out on this home.
Original Mortgage
$330,000
Outstanding Balance
$291,877
Interest Rate
4.9%
Mortgage Type
New Conventional
Estimated Equity
$209,987
Purchase Details
Closed on
Dec 19, 2018
Sold by
Stewart Robert C
Bought by
Lafferty Steven J and Baker Sari A
Home Financials for this Owner
Home Financials are based on the most recent Mortgage that was taken out on this home.
Original Mortgage
$330,000
Outstanding Balance
$291,877
Interest Rate
4.9%
Mortgage Type
New Conventional
Estimated Equity
$209,987
Purchase Details
Closed on
Aug 16, 2000
Sold by
Fisher Harold C and Fisher Mary L
Bought by
Stewart Robert C
Home Financials for this Owner
Home Financials are based on the most recent Mortgage that was taken out on this home.
Original Mortgage
$93,000
Interest Rate
8.13%
Mortgage Type
Seller Take Back
Create a Home Valuation Report for This Property
The Home Valuation Report is an in-depth analysis detailing your home's value as well as a comparison with similar homes in the area
Home Values in the Area
Average Home Value in this Area
Purchase History
| Date | Buyer | Sale Price | Title Company |
|---|---|---|---|
| Lafferty Steven J | $350,000 | Humboldt Land Title | |
| Lafferty Steven J | $350,000 | Humboldt Land Title | |
| Stewart Robert C | $133,000 | First American Title Co |
Source: Public Records
Mortgage History
| Date | Status | Borrower | Loan Amount |
|---|---|---|---|
| Open | Lafferty Steven J | $330,000 | |
| Closed | Lafferty Steven J | $330,000 | |
| Previous Owner | Stewart Robert C | $93,000 |
Source: Public Records
Tax History
| Year | Tax Paid | Tax Assessment Tax Assessment Total Assessment is a certain percentage of the fair market value that is determined by local assessors to be the total taxable value of land and additions on the property. | Land | Improvement |
|---|---|---|---|---|
| 2025 | $4,015 | $390,427 | $133,860 | $256,567 |
| 2024 | $4,015 | $382,773 | $131,236 | $251,537 |
| 2023 | $3,959 | $375,268 | $128,663 | $246,605 |
| 2022 | $4,110 | $367,911 | $126,141 | $241,770 |
| 2021 | $3,849 | $360,698 | $123,668 | $237,030 |
| 2020 | $3,820 | $357,000 | $122,400 | $234,600 |
| 2019 | $3,742 | $350,000 | $120,000 | $230,000 |
| 2018 | $1,892 | $176,119 | $66,208 | $109,911 |
| 2017 | $1,882 | $172,666 | $64,910 | $107,756 |
| 2016 | $1,882 | $169,282 | $63,638 | $105,644 |
| 2015 | $1,866 | $166,741 | $62,683 | $104,058 |
| 2014 | $1,744 | $163,476 | $61,456 | $102,020 |
Source: Public Records
Map
Nearby Homes
Your Personal Tour Guide
Ask me questions while you tour the home.