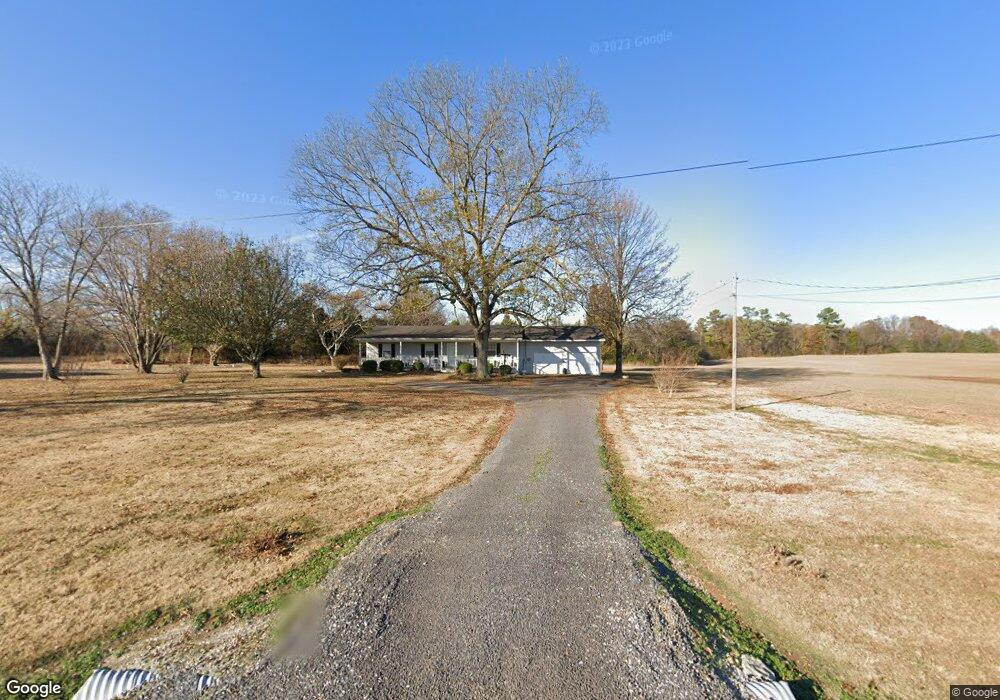
1827 Ardmore Hwy Ardmore, TN 38449
Estimated Value: $171,841 - $285,000
--
Bed
2
Baths
1,344
Sq Ft
$159/Sq Ft
Est. Value
About This Home
This home is located at 1827 Ardmore Hwy, Ardmore, TN 38449 and is currently estimated at $213,960, approximately $159 per square foot. 1827 Ardmore Hwy is a home located in Lincoln County with nearby schools including Blanche School, Lincoln Central Academy, and Lincoln County High School.
Ownership History
Date
Name
Owned For
Owner Type
Purchase Details
Closed on
Feb 17, 2023
Sold by
Ash-Stoneridge Llc
Bought by
Cross Mackenzie
Current Estimated Value
Home Financials for this Owner
Home Financials are based on the most recent Mortgage that was taken out on this home.
Original Mortgage
$310,000
Outstanding Balance
$300,534
Interest Rate
6.48%
Mortgage Type
Construction
Estimated Equity
-$86,574
Purchase Details
Closed on
May 27, 2022
Sold by
Cross Tommy J
Bought by
Cross Tyler J and Cross Tommy J
Purchase Details
Closed on
Jan 18, 2011
Sold by
Cross Vicki Lynn
Bought by
Cross Tommy J
Purchase Details
Closed on
Jul 21, 1989
Bought by
Cross Tommy Jerome
Purchase Details
Closed on
Jan 1, 1985
Bought by
Cross Tommy Jerome and Joyce Elaine
Create a Home Valuation Report for This Property
The Home Valuation Report is an in-depth analysis detailing your home's value as well as a comparison with similar homes in the area
Home Values in the Area
Average Home Value in this Area
Purchase History
| Date | Buyer | Sale Price | Title Company |
|---|---|---|---|
| Cross Mackenzie | $310,000 | -- | |
| Cross Tyler J | -- | Bobo Hunt & White | |
| Cross Tyler J | -- | Bobo Hunt & White | |
| Cross Tommy J | -- | -- | |
| Cross Tommy J | -- | -- | |
| Cross Tommy Jerome | -- | -- | |
| Cross Tommy Jerome | -- | -- | |
| Cross Tommy Jerome | $15,000 | -- | |
| Cross Tommy Jerome | $15,000 | -- |
Source: Public Records
Mortgage History
| Date | Status | Borrower | Loan Amount |
|---|---|---|---|
| Open | Cross Mackenzie | $310,000 |
Source: Public Records
Tax History Compared to Growth
Tax History
| Year | Tax Paid | Tax Assessment Tax Assessment Total Assessment is a certain percentage of the fair market value that is determined by local assessors to be the total taxable value of land and additions on the property. | Land | Improvement |
|---|---|---|---|---|
| 2024 | $894 | $47,075 | $7,050 | $40,025 |
| 2023 | $822 | $28,525 | $3,300 | $25,225 |
| 2022 | $607 | $28,900 | $3,675 | $25,225 |
| 2021 | $607 | $28,900 | $3,675 | $25,225 |
| 2020 | $607 | $28,900 | $3,675 | $25,225 |
| 2019 | $607 | $28,900 | $3,675 | $25,225 |
| 2018 | $543 | $21,900 | $3,250 | $18,650 |
| 2017 | $512 | $21,900 | $3,250 | $18,650 |
| 2016 | $512 | $21,900 | $3,250 | $18,650 |
| 2015 | -- | $21,900 | $3,250 | $18,650 |
| 2014 | $429 | $21,900 | $3,250 | $18,650 |
Source: Public Records
Map
Nearby Homes
- 0 Old Baptist Rd Unit RTC2968445
- 1759 Ardmore Hwy
- 1942 Ardmore Hwy
- 2.5 Acres Old Baptist Rd
- 1997 Ardmore Hwy
- 1999 Ardmore Hwy
- 1612 Ardmore Hwy
- 123 Jones Rd
- 2166, 2150,2154 State Line Rd
- 29742 Walker Dr
- 113 Elliot Rd
- 29419 Old School House Rd
- 239 Henry Bayless Rd
- 29831 Triple j Dr
- 66 Thompson Hollow Rd
- 0 Old Railroad Bed Rd Unit RTC2941749
- 0 Old Railroad Bed Rd Unit RTC2941746
- 0 Old Railroad Bed Rd Unit RTC2921051
- 1386 Stevenson Rd
- 30619 Highway 110
- 1829 Ardmore Hwy
- 2 You Take It Rd
- 2 You Take It Rd
- 2 U Take It Rd
- 1838 Ardmore Hwy
- 6 You Take It Rd
- 1834 Ardmore Hwy
- 1814 Ardmore Hwy
- 1838 Tennessee 110
- 1838 Hwy 110
- 1841 Ardmore Hwy
- 12 You Take It Rd
- 1843 Ardmore Hwy
- 1809 Ardmore Hwy
- 7 You Take It Rd
- 1842 Ardmore Hwy
- 0 Ardmore Hwy
- 16 You Take It Rd
- 17 Cross Cemetery Rd
- 1849 Ardmore Hwy