Estimated Value: $169,000 - $187,206
3
Beds
2
Baths
1,213
Sq Ft
$150/Sq Ft
Est. Value
About This Home
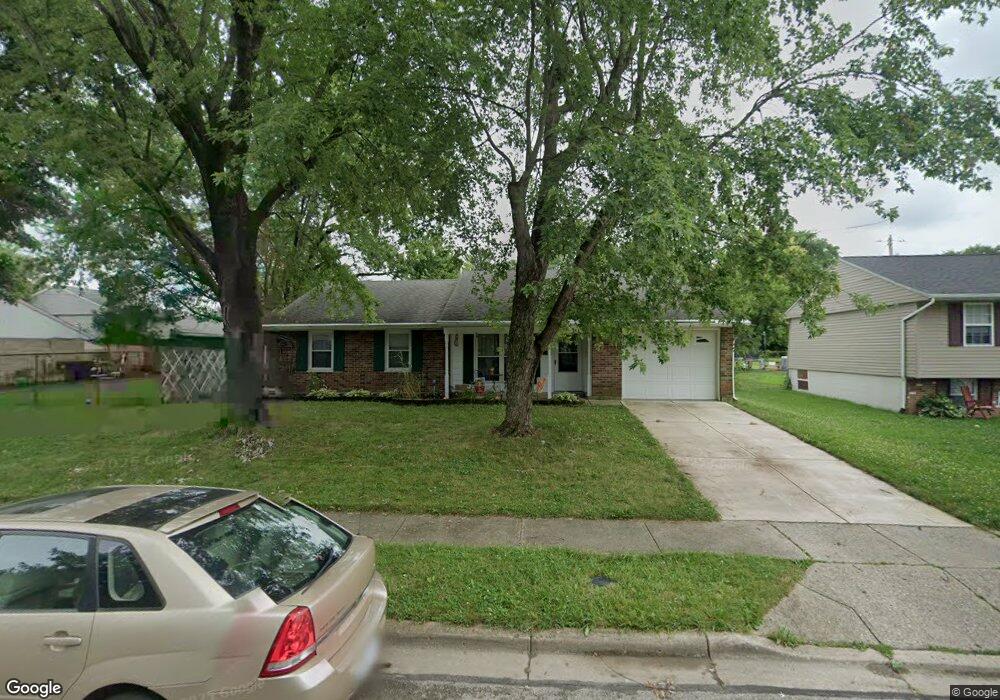
This home is located at 1827 Atkinson Dr, Xenia, OH 45385 and is currently estimated at $181,802, approximately $149 per square foot. 1827 Atkinson Dr is a home located in Greene County with nearby schools including Xenia High School, Summit Academy Community School for Alternative Learners - Xenia, and Legacy Christian Academy.
Ownership History
Date
Name
Owned For
Owner Type
Purchase Details
Closed on
Feb 17, 2012
Sold by
Nuchols Richard P
Bought by
Collier Suzanne M and Winkle Glen R
Current Estimated Value
Home Financials for this Owner
Home Financials are based on the most recent Mortgage that was taken out on this home.
Original Mortgage
$52,000
Outstanding Balance
$5,951
Interest Rate
3.91%
Mortgage Type
New Conventional
Estimated Equity
$175,851
Purchase Details
Closed on
Jul 13, 2001
Sold by
Caraway Patricia M
Bought by
Caraway Patricia M and The Patricia M Caraway Trust
Purchase Details
Closed on
Apr 2, 1996
Sold by
Ballard Dana A
Bought by
Caraway Hubert V and Caraway M
Home Financials for this Owner
Home Financials are based on the most recent Mortgage that was taken out on this home.
Original Mortgage
$35,000
Interest Rate
6.98%
Mortgage Type
New Conventional
Create a Home Valuation Report for This Property
The Home Valuation Report is an in-depth analysis detailing your home's value as well as a comparison with similar homes in the area
Home Values in the Area
Average Home Value in this Area
Purchase History
| Date | Buyer | Sale Price | Title Company |
|---|---|---|---|
| Collier Suzanne M | $65,000 | Attorney | |
| Caraway Patricia M | -- | -- | |
| Caraway Hubert V | $69,900 | -- |
Source: Public Records
Mortgage History
| Date | Status | Borrower | Loan Amount |
|---|---|---|---|
| Open | Collier Suzanne M | $52,000 | |
| Previous Owner | Caraway Hubert V | $35,000 |
Source: Public Records
Tax History Compared to Growth
Tax History
| Year | Tax Paid | Tax Assessment Tax Assessment Total Assessment is a certain percentage of the fair market value that is determined by local assessors to be the total taxable value of land and additions on the property. | Land | Improvement |
|---|---|---|---|---|
| 2024 | $1,980 | $46,270 | $10,430 | $35,840 |
| 2023 | $1,980 | $46,270 | $10,430 | $35,840 |
| 2022 | $1,651 | $32,900 | $6,140 | $26,760 |
| 2021 | $1,673 | $32,900 | $6,140 | $26,760 |
| 2020 | $1,603 | $32,900 | $6,140 | $26,760 |
| 2019 | $1,454 | $28,100 | $6,210 | $21,890 |
| 2018 | $1,460 | $28,100 | $6,210 | $21,890 |
| 2017 | $1,336 | $28,100 | $6,210 | $21,890 |
| 2016 | $1,337 | $25,250 | $6,210 | $19,040 |
| 2015 | $1,340 | $25,250 | $6,210 | $19,040 |
| 2014 | $1,284 | $25,250 | $6,210 | $19,040 |
Source: Public Records
Map
Nearby Homes
- 1866 Roxbury Dr
- 1908 Whitt St
- 1255 Colorado Dr
- 1829 Gayhart Dr
- 1403 Texas Dr
- 1769 Gayhart Dr
- 1107 Arkansas Dr
- 1778 Arapaho Dr
- 2499 Jenny Marie Dr
- 2257 Maryland Dr
- 2345 Tennessee Dr
- 2540 Jenny Marie Dr
- 2421 Louisiana Dr
- 1653 Seneca Dr
- 1618 Navajo Dr
- 2540 Cornwall Dr
- 2142 Michigan Dr
- 0 Berkshire Dr Unit 942854
- 1272 Bellbrook Ave
- 2545 Harmony Dr
- 1841 Atkinson Dr
- 1815 Atkinson Dr
- 1826 Crase Dr
- 1844 Crase Dr
- 1855 Atkinson Dr
- 1860 Crase Dr
- 1830 Mumford Ct
- 1816 Atkinson Dr
- 1912 Owen Ct
- 1900 Owen Ct
- 1758 Mumford Ct
- 1804 Atkinson Dr
- 1924 Owen Ct
- 1872 Crase Dr
- 1788 Atkinson Dr
- 1818 Mumford Ct
- 1783 Atkinson Dr
- 1870 Atkinson Dr
- 1884 Crase Dr
- 1815 Crase Dr