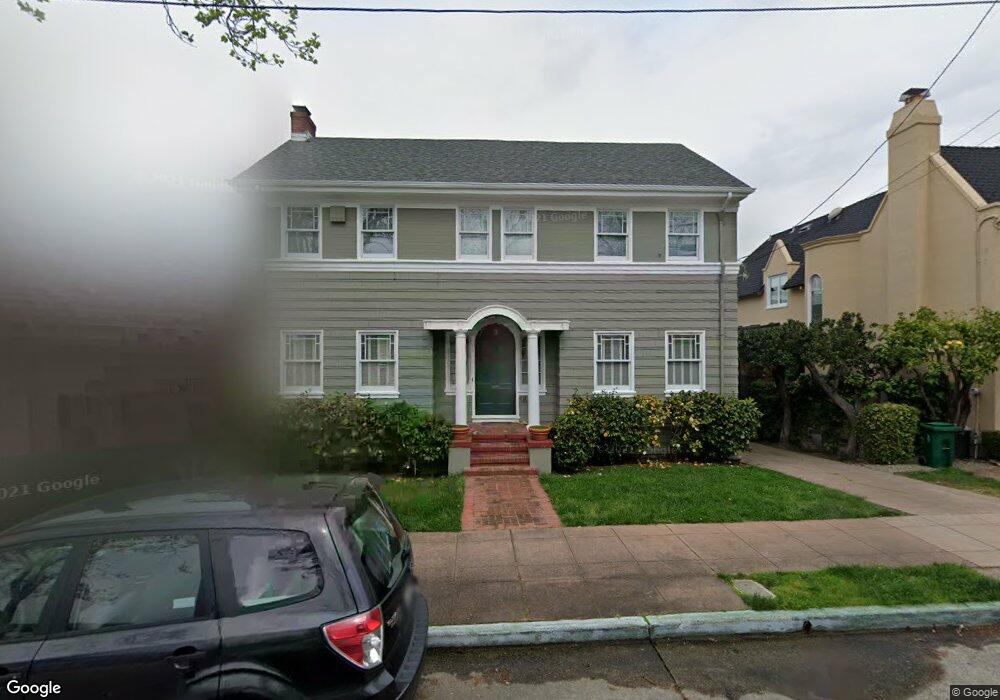
1827 Oakland Ave Piedmont, CA 94611
Central Piedmont NeighborhoodEstimated Value: $1,588,249 - $1,992,000
3
Beds
2
Baths
2,040
Sq Ft
$906/Sq Ft
Est. Value
About This Home
This home is located at 1827 Oakland Ave, Piedmont, CA 94611 and is currently estimated at $1,848,312, approximately $906 per square foot. 1827 Oakland Ave is a home located in Alameda County with nearby schools including Piedmont Middle School, Piedmont High School, and St. Leo the Great School.
Ownership History
Date
Name
Owned For
Owner Type
Purchase Details
Closed on
Dec 20, 2023
Sold by
Chan Clifford C and Chan Jennifer
Bought by
Chan Family Trust and Chan
Current Estimated Value
Purchase Details
Closed on
May 8, 2001
Sold by
Nathanson Adam and Leung Donna
Bought by
Chan Clifford C and Ngo Chan Jennifer Yim Wah
Home Financials for this Owner
Home Financials are based on the most recent Mortgage that was taken out on this home.
Original Mortgage
$479,500
Interest Rate
6.89%
Purchase Details
Closed on
Apr 22, 1997
Sold by
Gerard Sullivan Penelope W and Gerard Joseph
Bought by
Nathanson Adam and Leung Donna
Home Financials for this Owner
Home Financials are based on the most recent Mortgage that was taken out on this home.
Original Mortgage
$367,200
Interest Rate
7.94%
Purchase Details
Closed on
Jun 3, 1993
Sold by
Sullivan Penelope W
Bought by
Sullivan Penelope Walker and Sullivan Joseph Gerard
Create a Home Valuation Report for This Property
The Home Valuation Report is an in-depth analysis detailing your home's value as well as a comparison with similar homes in the area
Home Values in the Area
Average Home Value in this Area
Purchase History
| Date | Buyer | Sale Price | Title Company |
|---|---|---|---|
| Chan Family Trust | -- | None Listed On Document | |
| Chan Clifford C | $685,000 | Fidelity National Title Co | |
| Nathanson Adam | $459,000 | First American Title Guarant | |
| Sullivan Penelope Walker | -- | -- |
Source: Public Records
Mortgage History
| Date | Status | Borrower | Loan Amount |
|---|---|---|---|
| Previous Owner | Chan Clifford C | $479,500 | |
| Previous Owner | Nathanson Adam | $367,200 | |
| Closed | Nathanson Adam | $45,900 |
Source: Public Records
Tax History Compared to Growth
Tax History
| Year | Tax Paid | Tax Assessment Tax Assessment Total Assessment is a certain percentage of the fair market value that is determined by local assessors to be the total taxable value of land and additions on the property. | Land | Improvement |
|---|---|---|---|---|
| 2025 | $17,207 | $1,025,110 | $309,633 | $722,477 |
| 2024 | $17,207 | $1,004,874 | $303,562 | $708,312 |
| 2023 | $16,936 | $985,037 | $297,611 | $694,426 |
| 2022 | $16,470 | $965,590 | $291,777 | $680,813 |
| 2021 | $15,765 | $946,520 | $286,056 | $667,464 |
| 2020 | $15,696 | $943,744 | $283,123 | $660,621 |
| 2019 | $15,451 | $925,242 | $277,572 | $647,670 |
| 2018 | $14,938 | $907,104 | $272,131 | $634,973 |
| 2017 | $14,930 | $889,321 | $266,796 | $622,525 |
| 2016 | $13,895 | $871,887 | $261,566 | $610,321 |
| 2015 | $13,885 | $858,797 | $257,639 | $601,158 |
| 2014 | $13,739 | $841,981 | $252,594 | $589,387 |
Source: Public Records
Map
Nearby Homes
- 2058 Oakland Ave
- 180 Hillside Ave
- 108 Hillside Ave
- 295 Scenic Ave
- 415 Pacific Ave
- 133 Monticello Ave
- 33 Richardson Way
- 1140 Winsor Ave
- 0 Fair Ave Unit 41113850
- 25 Crocker Ave
- 73 Fairview Ave
- 5555 Moraga Ave
- 29 Cambridge Way
- 4509 Moraga Ave
- 1074 Annerley Rd
- 5621 Maxwelton Rd
- 61 Wildwood Ave
- 26 Sea View Ave
- 5630 Moraga Ave
- 45 Glen Alpine Rd
- 235 Highland Ave
- 1823 Oakland Ave
- 229 Highland Ave
- 1819 Oakland Ave
- 301 Highland Ave
- 225 Highland Ave
- 1815 Oakland Ave
- 221 Highland Ave
- 1811 Oakland Ave
- 309 Highland Ave
- 219 Highland Ave
- 230 Highland Ave
- 311 Highland Ave
- 224 Highland Ave
- 230 Bonita Ave
- 240 Bonita Ave
- 222 Highland Ave
- 1900 Oakland Ave
- 215 Highland Ave
- 315 Highland Ave