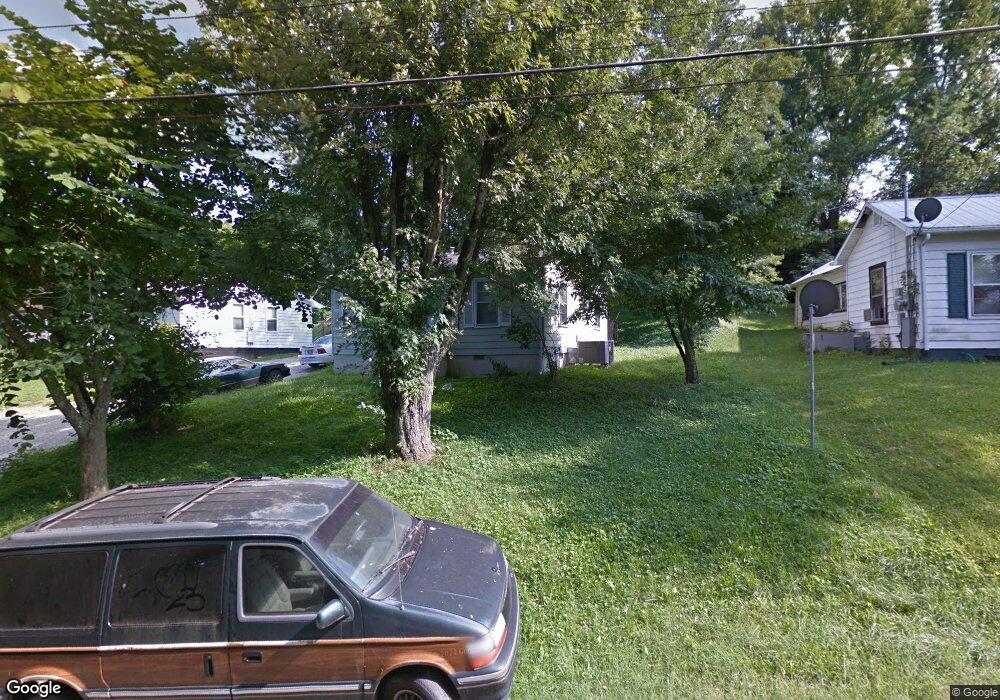
1828 Emerson St Morristown, TN 37814
Estimated Value: $73,000 - $130,000
--
Bed
1
Bath
666
Sq Ft
$149/Sq Ft
Est. Value
About This Home
This home is located at 1828 Emerson St, Morristown, TN 37814 and is currently estimated at $98,984, approximately $148 per square foot. 1828 Emerson St is a home located in Hamblen County with nearby schools including Fairview-Marguerite Elementary School, Meadowview Middle School, and Morristown East High School.
Ownership History
Date
Name
Owned For
Owner Type
Purchase Details
Closed on
Jan 24, 2008
Sold by
Bretz-Dowell Peggy
Bought by
Dowell Roger G
Current Estimated Value
Home Financials for this Owner
Home Financials are based on the most recent Mortgage that was taken out on this home.
Original Mortgage
$46,200
Interest Rate
6.17%
Purchase Details
Closed on
Nov 19, 2004
Sold by
Hinton Steve S
Bought by
Dowell Roger G
Purchase Details
Closed on
Aug 7, 1995
Sold by
Beverly Killion
Bought by
Steve Hinton
Purchase Details
Closed on
Jul 19, 1995
Sold by
Beverly Killion
Bought by
Ellis Winstead
Purchase Details
Closed on
Aug 16, 1994
Sold by
Killion Ivan
Bought by
Beverly Killion
Purchase Details
Closed on
Sep 8, 1993
Bought by
Killion Beverly and Killion Ivan
Purchase Details
Closed on
Nov 4, 1977
Bought by
Johnagin Johnny C and Johnagin Elaine R
Create a Home Valuation Report for This Property
The Home Valuation Report is an in-depth analysis detailing your home's value as well as a comparison with similar homes in the area
Home Values in the Area
Average Home Value in this Area
Purchase History
| Date | Buyer | Sale Price | Title Company |
|---|---|---|---|
| Dowell Roger G | -- | -- | |
| Dowell Roger G | $35,000 | -- | |
| Steve Hinton | $39,900 | -- | |
| Ellis Winstead | $32,550 | -- | |
| Beverly Killion | -- | -- | |
| Killion Beverly | $23,700 | -- | |
| Johnagin Johnny C | $11,600 | -- |
Source: Public Records
Mortgage History
| Date | Status | Borrower | Loan Amount |
|---|---|---|---|
| Closed | Johnagin Johnny C | $46,200 |
Source: Public Records
Tax History Compared to Growth
Tax History
| Year | Tax Paid | Tax Assessment Tax Assessment Total Assessment is a certain percentage of the fair market value that is determined by local assessors to be the total taxable value of land and additions on the property. | Land | Improvement |
|---|---|---|---|---|
| 2024 | $202 | $11,475 | $2,025 | $9,450 |
| 2023 | $202 | $11,475 | $0 | $0 |
| 2022 | $363 | $11,475 | $2,025 | $9,450 |
| 2021 | $363 | $11,475 | $2,025 | $9,450 |
| 2020 | $362 | $11,475 | $2,025 | $9,450 |
| 2019 | $354 | $10,400 | $2,225 | $8,175 |
| 2018 | $328 | $10,400 | $2,225 | $8,175 |
| 2017 | $323 | $10,400 | $2,225 | $8,175 |
| 2016 | $308 | $10,400 | $2,225 | $8,175 |
| 2015 | $286 | $10,400 | $2,225 | $8,175 |
| 2014 | -- | $10,400 | $2,225 | $8,175 |
| 2013 | -- | $11,475 | $0 | $0 |
Source: Public Records
Map
Nearby Homes
- 2035 Reese St
- 1250 N Liberty Hill Dr
- 2165 Brights Pike
- 1864 Limestone Path
- 1449 N Easley Ct
- 1683 Pebblestone Ct
- 2320 Southern Dr
- 910 Lloyd St
- 2052 Fairview Rd
- 1961 Brights View Ln
- 1250 N Liberty Hill Rd
- 000 Devault St
- 1635 Meadowview Ln
- 1643 Meadowview Ln
- 1420 Buffalo Trail
- 1504 Tyler Cir
- 1486 Short St
- 1111 Carmichael St
- 1562 Shields Ferry Rd
- 1542 Shields Ferry Rd
- 1832 Emerson St
- 1822 Emerson St
- 1834 Emerson St
- 1833 Emerson St
- 1810 Emerson St
- 1852 Emerson St
- 1820 Sherwood Dr
- 1806 Emerson St
- 1910 Sherwood Dr
- 1910 Sherwood Dr
- 1860 Emerson St
- 1905 N Liberty Hill Rd
- 1802 Sherwood Dr
- 1915 N Liberty Hill Rd
- 1829 N Liberty Hill Rd
- 1905 N Liberty Hill Dr
- 1821 N Liberty Hill Rd
- 1866 Emerson St
- 0 Medlin Rd
- 1815 N Liberty Hill Rd