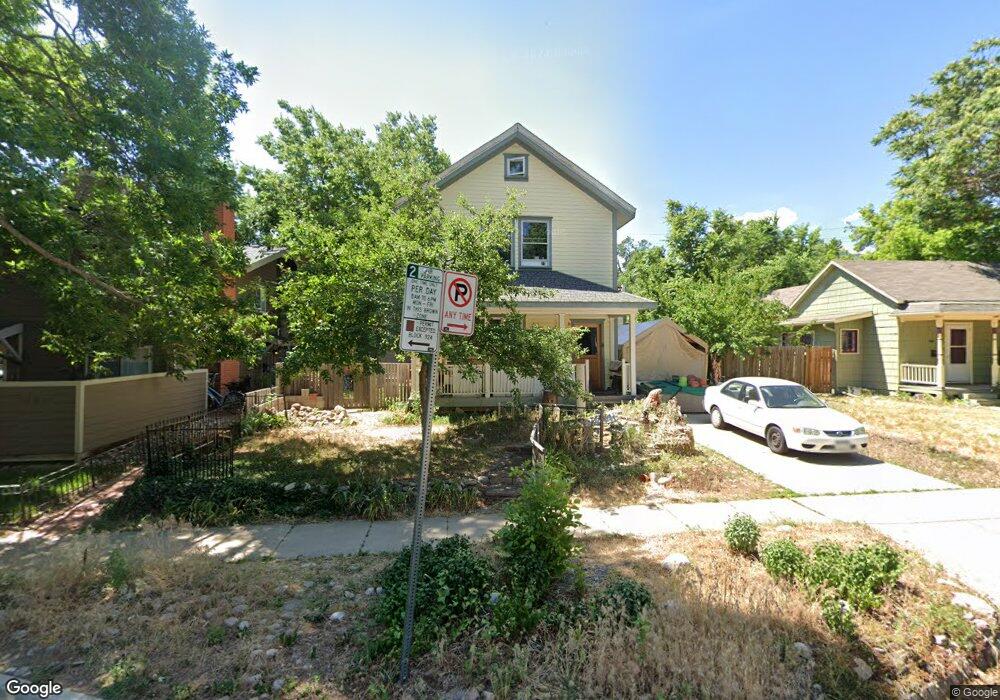
1828 Grove St Boulder, CO 80302
Goss-Grove NeighborhoodEstimated Value: $1,246,000 - $1,657,000
3
Beds
3
Baths
1,804
Sq Ft
$805/Sq Ft
Est. Value
About This Home
This home is located at 1828 Grove St, Boulder, CO 80302 and is currently estimated at $1,453,002, approximately $805 per square foot. 1828 Grove St is a home located in Boulder County with nearby schools including Whittier Elementary School, Casey Middle School, and Boulder High School.
Ownership History
Date
Name
Owned For
Owner Type
Purchase Details
Closed on
Mar 1, 2002
Sold by
Poole Jean D Ashley
Bought by
Ashley Roseanne E
Current Estimated Value
Purchase Details
Closed on
Aug 28, 1996
Sold by
Fair Isabelle C
Bought by
Ashley Roseanne
Home Financials for this Owner
Home Financials are based on the most recent Mortgage that was taken out on this home.
Original Mortgage
$146,000
Outstanding Balance
$12,581
Interest Rate
8.24%
Estimated Equity
$1,440,421
Purchase Details
Closed on
Aug 9, 1989
Bought by
Ashley Roseanne E
Purchase Details
Closed on
Sep 8, 1986
Bought by
Ashley Roseanne E
Purchase Details
Closed on
Mar 1, 1983
Bought by
Ashley Roseanne E
Create a Home Valuation Report for This Property
The Home Valuation Report is an in-depth analysis detailing your home's value as well as a comparison with similar homes in the area
Home Values in the Area
Average Home Value in this Area
Purchase History
| Date | Buyer | Sale Price | Title Company |
|---|---|---|---|
| Ashley Roseanne E | -- | -- | |
| Ashley Roseanne | $182,500 | -- | |
| Ashley Roseanne E | $105,000 | -- | |
| Ashley Roseanne E | $95,000 | -- | |
| Ashley Roseanne E | $82,000 | -- |
Source: Public Records
Mortgage History
| Date | Status | Borrower | Loan Amount |
|---|---|---|---|
| Open | Ashley Roseanne | $146,000 |
Source: Public Records
Tax History Compared to Growth
Tax History
| Year | Tax Paid | Tax Assessment Tax Assessment Total Assessment is a certain percentage of the fair market value that is determined by local assessors to be the total taxable value of land and additions on the property. | Land | Improvement |
|---|---|---|---|---|
| 2025 | $7,738 | $80,925 | $52,069 | $28,856 |
| 2024 | $7,738 | $80,925 | $52,069 | $28,856 |
| 2023 | $7,604 | $88,051 | $60,628 | $31,108 |
| 2022 | $6,502 | $70,021 | $45,599 | $24,422 |
| 2021 | $6,201 | $72,036 | $46,911 | $25,125 |
| 2020 | $5,538 | $63,621 | $43,186 | $20,435 |
| 2019 | $5,453 | $63,621 | $43,186 | $20,435 |
| 2018 | $5,051 | $58,255 | $31,536 | $26,719 |
| 2017 | $4,893 | $64,405 | $34,865 | $29,540 |
| 2016 | $4,875 | $56,317 | $32,079 | $24,238 |
| 2015 | $4,616 | $40,030 | $20,417 | $19,613 |
| 2014 | $3,366 | $40,030 | $20,417 | $19,613 |
Source: Public Records
Map
Nearby Homes
- 1922 Grove St
- 1944 Arapahoe Ave Unit A
- 1629 17th St Unit A
- 1842 Canyon Blvd Unit 105
- 1842 Canyon Blvd Unit 202
- 1945 Canyon Blvd
- 1723 15th St
- 2205 Arapahoe Ave Unit 3
- 1707 Walnut St Unit 203
- 1707 Walnut St Unit 209
- 1707 Walnut St Unit 307
- 1707 Walnut St Unit 208
- 1707 Walnut St Unit 308
- 1707 Walnut St Unit 101
- 1707 Walnut St Unit 103
- 1707 Walnut St Unit 207
- 1707 Walnut St Unit 206
- 1707 Walnut St Unit 202
- 1707 Walnut St Unit 210
- 1837 Walnut St Unit E
- 1834 Grove St Unit 3
- 1834 Grove St Unit 2
- 1834 Grove St Unit 1
- 1818 Grove St
- 1820 Grove St
- 1840 Grove St
- 1816 Grove St
- 945 30th St A B C D C
- 0 Boulder Peak Ranch Lot 5 Unit 98414448
- 0 Boulder Peak Ranch Lot 4 Unit 98414108
- 0 Boulder Peak Ranch Lot 2 Unit 98414083
- 0 Boulder Peak Ranch Lot 1 Unit 98413943
- 1829 Arapahoe Ave
- 1833 Arapahoe Ave
- 1515 19th St
- 1839 Arapahoe Ave
- 1827 Arapahoe Ave
- 1800 Arapahoe Ave
- 1817 Arapahoe Ave
- 1843 Grove St