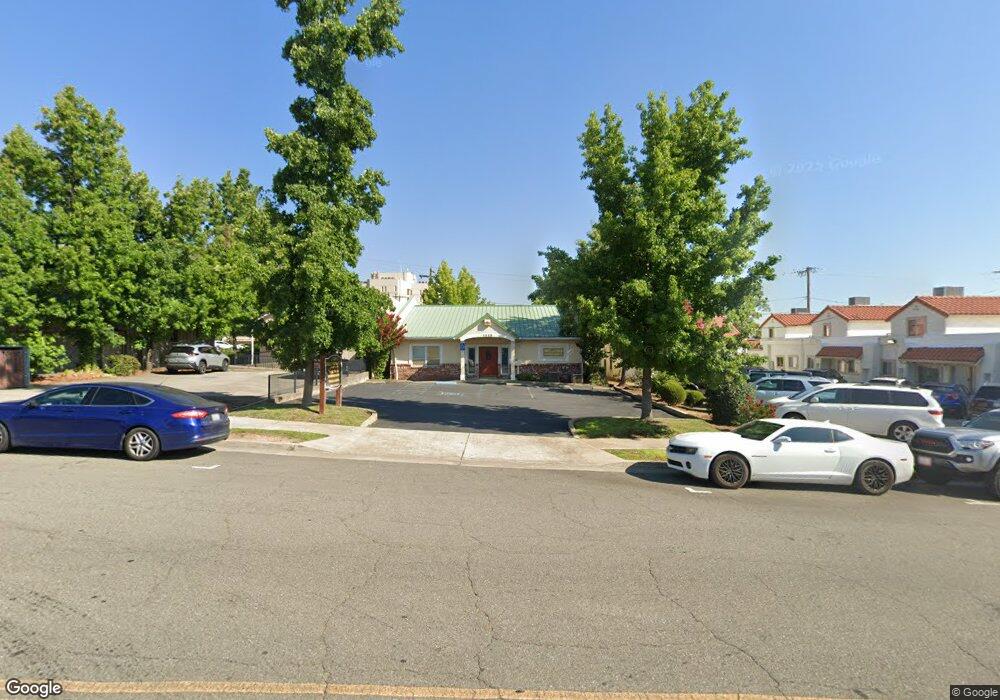
1828 South St Redding, CA 96001
Downtown Redding NeighborhoodEstimated Value: $386,688
Studio
--
Bath
2,070
Sq Ft
$187/Sq Ft
Est. Value
About This Home
This home is located at 1828 South St, Redding, CA 96001 and is currently estimated at $386,688, approximately $186 per square foot. 1828 South St is a home located in Shasta County with nearby schools including Cypress Elementary School, Sequoia Middle School, and Shasta High School.
Ownership History
Date
Name
Owned For
Owner Type
Purchase Details
Closed on
Nov 14, 2024
Sold by
Fisher Family Revocable Trust and Fisher Clifford M
Bought by
Morfin Amber Lyn
Current Estimated Value
Home Financials for this Owner
Home Financials are based on the most recent Mortgage that was taken out on this home.
Original Mortgage
$285,000
Outstanding Balance
$282,163
Interest Rate
6.12%
Mortgage Type
New Conventional
Estimated Equity
$104,525
Create a Home Valuation Report for This Property
The Home Valuation Report is an in-depth analysis detailing your home's value as well as a comparison with similar homes in the area
Home Values in the Area
Average Home Value in this Area
Purchase History
| Date | Buyer | Sale Price | Title Company |
|---|---|---|---|
| Morfin Amber Lyn | $385,000 | Placer Title | |
| Morfin Amber Lyn | $385,000 | Placer Title |
Source: Public Records
Mortgage History
| Date | Status | Borrower | Loan Amount |
|---|---|---|---|
| Open | Morfin Amber Lyn | $285,000 | |
| Closed | Morfin Amber Lyn | $285,000 |
Source: Public Records
Tax History
| Year | Tax Paid | Tax Assessment Tax Assessment Total Assessment is a certain percentage of the fair market value that is determined by local assessors to be the total taxable value of land and additions on the property. | Land | Improvement |
|---|---|---|---|---|
| 2025 | $3,507 | $385,000 | $120,000 | $265,000 |
| 2024 | $3,453 | $329,314 | $82,320 | $246,994 |
| 2023 | $3,453 | $322,857 | $80,706 | $242,151 |
| 2022 | $3,395 | $316,527 | $79,124 | $237,403 |
| 2021 | $3,374 | $310,322 | $77,573 | $232,749 |
| 2020 | $3,419 | $307,141 | $76,778 | $230,363 |
| 2019 | $3,246 | $301,120 | $75,273 | $225,847 |
| 2018 | $3,275 | $295,217 | $73,798 | $221,419 |
| 2017 | $3,258 | $289,429 | $72,351 | $217,078 |
| 2016 | $3,155 | $283,755 | $70,933 | $212,822 |
| 2015 | $3,115 | $279,494 | $69,868 | $209,626 |
| 2014 | $3,094 | $274,020 | $68,500 | $205,520 |
Source: Public Records
Map
Nearby Homes
- 3024 West St
- 2381/2401 West St
- 2330 West St
- 1868 Gold St
- 0 California St Unit 25-5331
- 1777 Magnolia Ave
- 2123 Waldon St
- 2077 Skyline Dr
- 2315 Butte St
- 1545 Olive Ave
- 2405 Cliff Dr
- 1569 Walnut Ave
- 2514 California St
- 2239 Garden Ave
- 815 Locust St
- 1066 Pine St
- 2565 North St
- 1012 State St
- 1191 Hillcrest Place
- 2056 Canal Dr
Your Personal Tour Guide
Ask me questions while you tour the home.