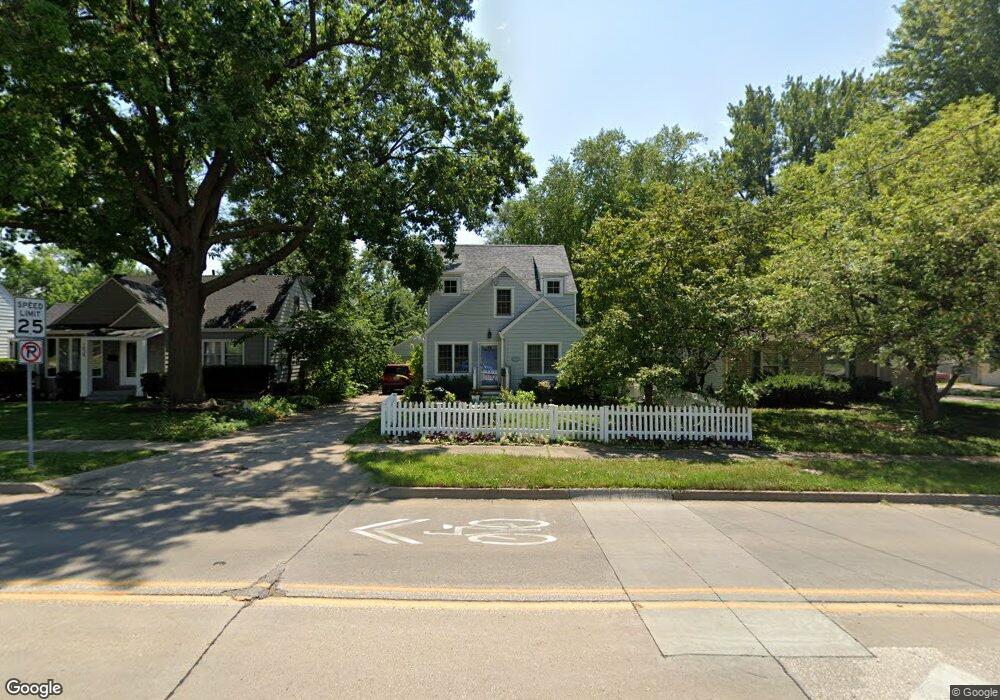
1828 Vine St West Des Moines, IA 50265
Estimated Value: $249,822 - $271,000
2
Beds
2
Baths
1,426
Sq Ft
$181/Sq Ft
Est. Value
About This Home
This home is located at 1828 Vine St, West Des Moines, IA 50265 and is currently estimated at $258,706, approximately $181 per square foot. 1828 Vine St is a home located in Polk County with nearby schools including Hillside Elementary School, Stilwell Junior High School, and Valley Southwoods Freshman High School.
Ownership History
Date
Name
Owned For
Owner Type
Purchase Details
Closed on
Nov 13, 1997
Sold by
Hartshorn Jeffery Lee and Hartshorn Lisa Marie
Bought by
Walke Jason D
Current Estimated Value
Home Financials for this Owner
Home Financials are based on the most recent Mortgage that was taken out on this home.
Original Mortgage
$92,440
Outstanding Balance
$15,372
Interest Rate
7.43%
Estimated Equity
$243,334
Create a Home Valuation Report for This Property
The Home Valuation Report is an in-depth analysis detailing your home's value as well as a comparison with similar homes in the area
Home Values in the Area
Average Home Value in this Area
Purchase History
| Date | Buyer | Sale Price | Title Company |
|---|---|---|---|
| Walke Jason D | $95,000 | -- |
Source: Public Records
Mortgage History
| Date | Status | Borrower | Loan Amount |
|---|---|---|---|
| Open | Walke Jason D | $92,440 |
Source: Public Records
Tax History Compared to Growth
Tax History
| Year | Tax Paid | Tax Assessment Tax Assessment Total Assessment is a certain percentage of the fair market value that is determined by local assessors to be the total taxable value of land and additions on the property. | Land | Improvement |
|---|---|---|---|---|
| 2025 | $3,104 | $217,100 | $54,200 | $162,900 |
| 2024 | $3,104 | $195,800 | $48,300 | $147,500 |
| 2023 | $3,156 | $195,800 | $48,300 | $147,500 |
| 2022 | $3,118 | $163,400 | $41,800 | $121,600 |
| 2021 | $2,984 | $163,400 | $41,800 | $121,600 |
| 2020 | $2,940 | $148,800 | $38,000 | $110,800 |
| 2019 | $2,802 | $148,800 | $38,000 | $110,800 |
| 2018 | $2,808 | $136,800 | $34,400 | $102,400 |
| 2017 | $2,706 | $136,800 | $34,400 | $102,400 |
| 2016 | $2,646 | $128,000 | $31,700 | $96,300 |
| 2015 | $2,646 | $128,000 | $31,700 | $96,300 |
| 2014 | $2,544 | $125,400 | $30,500 | $94,900 |
Source: Public Records
Map
Nearby Homes
- 1829 Locust St
- 417 18th Place
- 1829 Pearl Dr
- 1916 Locust St
- 1809 Pearl Dr
- 2009 Vine St
- 720 19th St
- 2021 Elm Cir
- 725 20th St
- 1909 Prospect Ave
- 2006 Maple Cir
- 2002 Maple Cir
- 262 23rd St
- 2300 Locust St
- 248 Holiday Cir Unit 37
- 2100 Meadow Brook Dr Unit 103
- 2412 Fairlawn Dr
- 842 23rd St
- 536 14th St
- 2013 Crown Flair Dr