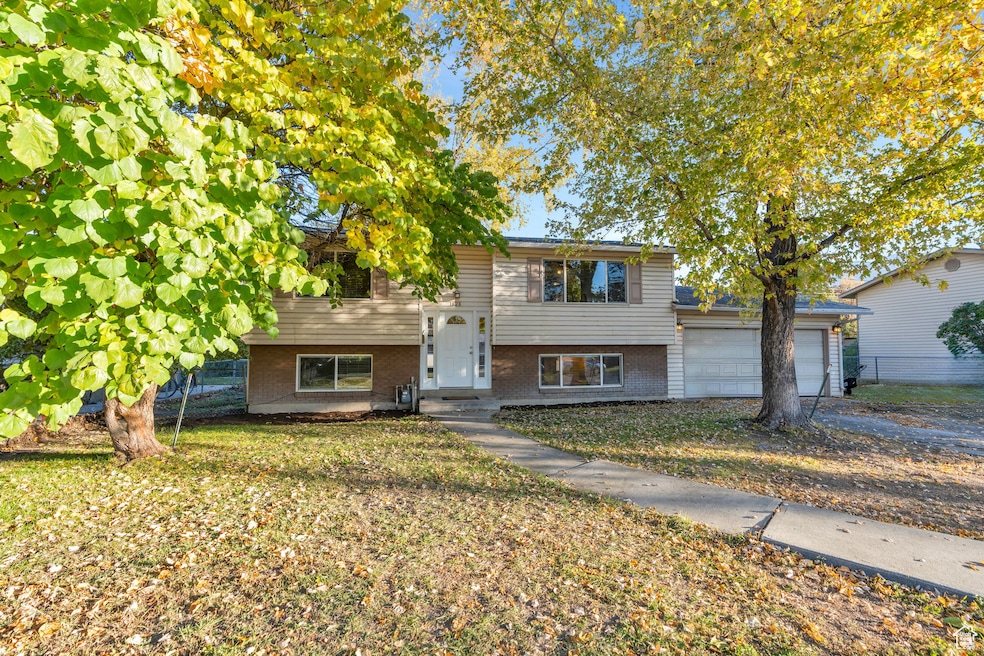
1828 W 170 S Provo, UT 84601
Franklin NeighborhoodEstimated payment $2,691/month
Highlights
- Very Popular Property
- No HOA
- In-Law or Guest Suite
- Mature Trees
- 2 Car Attached Garage
- Double Pane Windows
About This Home
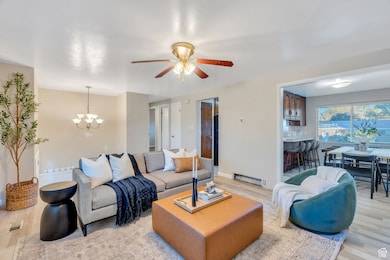
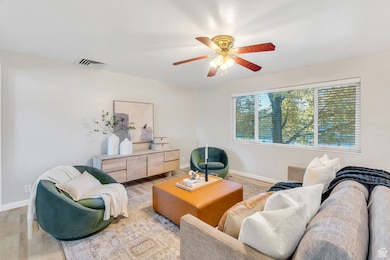
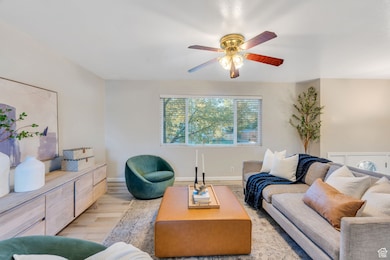
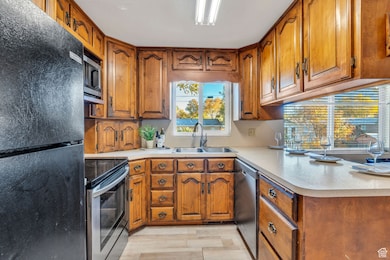
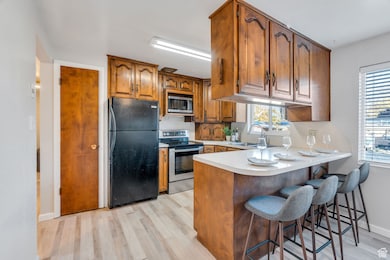
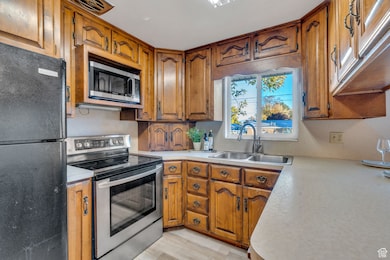
Nestled in a quiet neighborhood in West Provo, this home is conveniently located near schools and I-15. It features 2 kitchens, and the basement could be used as a separate mother-in-law apartment, or else more space for entertaining. The home has 4 bedrooms and 2 baths. It has brand-new flooring and paint throughout the house. Situated on a beautiful lot with large mature trees and mountain views. Call for a showing today.
Home Details
Home Type
- Single Family
Est. Annual Taxes
- $2,312
Year Built
- Built in 1970
Lot Details
- 8,712 Sq Ft Lot
- Lot Dimensions are 80.0x98.0x80.0
- Property is Fully Fenced
- Sprinkler System
- Mature Trees
- Vegetable Garden
- Zoning described as 111
Parking
- 2 Car Attached Garage
Home Design
- Split Level Home
- Brick Exterior Construction
Interior Spaces
- 1,728 Sq Ft Home
- 2-Story Property
- Double Pane Windows
- Blinds
- Basement
- Exterior Basement Entry
- Free-Standing Range
- Electric Dryer Hookup
Flooring
- Carpet
- Linoleum
Bedrooms and Bathrooms
- 4 Bedrooms | 2 Main Level Bedrooms
- In-Law or Guest Suite
Schools
- Sunset View Elementary School
- Provo High School
Utilities
- Central Heating and Cooling System
Community Details
- No Home Owners Association
- Lakeway Subdivision
Listing and Financial Details
- Assessor Parcel Number 45-013-0009
Map
Home Values in the Area
Average Home Value in this Area
Tax History
| Year | Tax Paid | Tax Assessment Tax Assessment Total Assessment is a certain percentage of the fair market value that is determined by local assessors to be the total taxable value of land and additions on the property. | Land | Improvement |
|---|---|---|---|---|
| 2025 | $2,199 | $230,780 | $157,400 | $262,200 |
| 2024 | $2,199 | $216,425 | $0 | $0 |
| 2023 | $2,150 | $208,670 | $0 | $0 |
| 2022 | $2,180 | $213,290 | $0 | $0 |
| 2021 | $1,713 | $292,400 | $88,800 | $203,600 |
| 2020 | $1,661 | $265,800 | $80,700 | $185,100 |
| 2019 | $1,457 | $242,400 | $80,700 | $161,700 |
| 2018 | $1,270 | $214,300 | $73,700 | $140,600 |
| 2017 | $1,179 | $109,340 | $0 | $0 |
| 2016 | $1,163 | $100,485 | $0 | $0 |
| 2015 | $1,041 | $90,915 | $0 | $0 |
| 2014 | $885 | $80,630 | $0 | $0 |
Property History
| Date | Event | Price | List to Sale | Price per Sq Ft |
|---|---|---|---|---|
| 11/08/2025 11/08/25 | Price Changed | $475,000 | 0.0% | $275 / Sq Ft |
| 11/03/2025 11/03/25 | Price Changed | $475,001 | 0.0% | $275 / Sq Ft |
| 10/24/2025 10/24/25 | For Sale | $475,000 | -- | $275 / Sq Ft |
Purchase History
| Date | Type | Sale Price | Title Company |
|---|---|---|---|
| Warranty Deed | -- | Utah Standard Title | |
| Interfamily Deed Transfer | -- | Title West Title Co | |
| Warranty Deed | -- | -- |
Mortgage History
| Date | Status | Loan Amount | Loan Type |
|---|---|---|---|
| Closed | $22,600 | Stand Alone Second | |
| Open | $120,800 | Fannie Mae Freddie Mac | |
| Previous Owner | $133,000 | No Value Available | |
| Previous Owner | $113,702 | FHA |
Source: UtahRealEstate.com
MLS Number: 2119341
APN: 45-013-0009
Disclaimer: Certain information contained herein is derived from information provided by parties other than Homes.com. All information provided is deemed reliable, but is not guaranteed to be accurate and should be independently verified.
![]() IDX information is provided exclusively for consumers’ personal, non-commercial use, that it may not be used for any purpose other than to identify prospective properties consumers may be interested in purchasing, and that the data is deemed reliable but is not guaranteed accurate by the MLS. Licensor is only providing the MLS Content and not other sources of data provided in the Product.
IDX information is provided exclusively for consumers’ personal, non-commercial use, that it may not be used for any purpose other than to identify prospective properties consumers may be interested in purchasing, and that the data is deemed reliable but is not guaranteed accurate by the MLS. Licensor is only providing the MLS Content and not other sources of data provided in the Product.
Based on information from the Wasatch Front Regional Multiple Listing Service, Inc.. All data, including all measurements and calculations of area, is obtained from various sources and has not been, and will not be, verified by broker or the MLS. All information should be independently reviewed and verified for accuracy. Properties may or may not be listed by the office/agent presenting the information.
- 147 S 1680 W
- 312 S 1920 W
- 1744 W 150 N
- 1492 W Parkside Dr
- 255 N 1600 W Unit 148
- 255 N 1600 W Unit 52
- 255 N 1600 W Unit 84
- 265 S 2370 W
- 386 S 2390 W
- 968 W 265 N Unit 4
- 1303 W 600 S
- 1375 W 500 N Unit 95
- 398 N 2380 W
- 2216 W 480 N
- 1150 W 100 N Unit 9
- 1148 W 100 N
- 1146 W 100 N
- 321 N 1220 W
- 154 N 2560 W
- 221 S 1050 W Unit 35
- 1214 W 500 N
- 160 N 800 W Unit Upstairs Unit
- 750 S 650 W
- 300 W Center St
- 1287 Reese Dr
- 810 N 600 W
- 556 W 800 N Unit Spacious Condo in Provo
- 61 W 400 S
- 480 N Freedom Blvd
- 1227 Riverside Ave Unit 60
- 77 W 500 S
- 538 N Freedom Blvd
- 1245 Riverside Ave Unit 37
- 255 S University Ave
- 63 E Center St
- 34 E 700 N
- 34 E 700 N
- 1710 Hickory Ln
- 1547 N Riverside Ave Unit 54-C
- 1541 N Riverside Ave Unit 15
