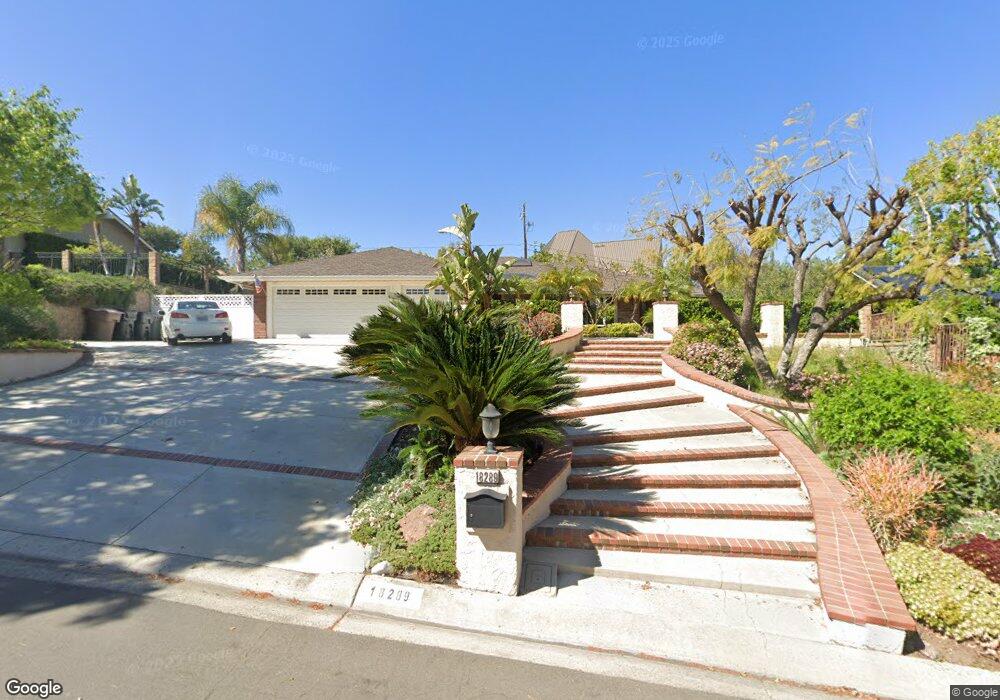
18289 Laurel View Dr Yorba Linda, CA 92886
Estimated Value: $1,559,538 - $1,690,000
4
Beds
3
Baths
2,350
Sq Ft
$695/Sq Ft
Est. Value
About This Home
This home is located at 18289 Laurel View Dr, Yorba Linda, CA 92886 and is currently estimated at $1,633,635, approximately $695 per square foot. 18289 Laurel View Dr is a home located in Orange County with nearby schools including Linda Vista Elementary School, Yorba Linda Middle School, and Friends Christian School.
Ownership History
Date
Name
Owned For
Owner Type
Purchase Details
Closed on
May 22, 2008
Sold by
First Newport Properties Llc
Bought by
Minor Gregory L and Minor Donna M
Current Estimated Value
Home Financials for this Owner
Home Financials are based on the most recent Mortgage that was taken out on this home.
Original Mortgage
$488,000
Interest Rate
6.5%
Mortgage Type
Purchase Money Mortgage
Purchase Details
Closed on
Mar 18, 2008
Sold by
Sanford Darrell K and Sanford Margie L
Bought by
First Newport Properties Llc
Purchase Details
Closed on
Aug 11, 2004
Sold by
Sanford Christopher Keith and Sanford Darrell Keith
Bought by
Sanford Christopher K and Sanford Lori
Purchase Details
Closed on
May 6, 2004
Sold by
Sanford Christopher Keith
Bought by
Sanford Margie L
Create a Home Valuation Report for This Property
The Home Valuation Report is an in-depth analysis detailing your home's value as well as a comparison with similar homes in the area
Home Values in the Area
Average Home Value in this Area
Purchase History
| Date | Buyer | Sale Price | Title Company |
|---|---|---|---|
| Minor Gregory L | -- | Fnt | |
| First Newport Properties Llc | $480,800 | None Available | |
| Sanford Christopher K | -- | -- | |
| Sanford Margie L | -- | -- |
Source: Public Records
Mortgage History
| Date | Status | Borrower | Loan Amount |
|---|---|---|---|
| Previous Owner | Minor Gregory L | $488,000 |
Source: Public Records
Tax History Compared to Growth
Tax History
| Year | Tax Paid | Tax Assessment Tax Assessment Total Assessment is a certain percentage of the fair market value that is determined by local assessors to be the total taxable value of land and additions on the property. | Land | Improvement |
|---|---|---|---|---|
| 2025 | $8,719 | $785,529 | $519,892 | $265,637 |
| 2024 | $8,719 | $770,127 | $509,698 | $260,429 |
| 2023 | $8,564 | $755,027 | $499,704 | $255,323 |
| 2022 | $8,484 | $740,223 | $489,906 | $250,317 |
| 2021 | $8,332 | $725,709 | $480,300 | $245,409 |
| 2020 | $8,235 | $718,268 | $475,375 | $242,893 |
| 2019 | $7,946 | $704,185 | $466,054 | $238,131 |
| 2018 | $7,847 | $690,378 | $456,916 | $233,462 |
| 2017 | $7,719 | $676,842 | $447,957 | $228,885 |
| 2016 | $7,562 | $663,571 | $439,173 | $224,398 |
| 2015 | $7,470 | $653,604 | $432,576 | $221,028 |
| 2014 | $7,248 | $640,801 | $424,102 | $216,699 |
Source: Public Records
Map
Nearby Homes
- 5152 Lakeview Ave
- 18571 Buena Vista Ave
- 18083 Burke Ln
- 18044 Burke Ln
- 5231 Highland Ave
- 4951 Oak Tree Ct
- 5141 Siesta Ln
- 4760 Lakeview Ave
- 4788 Lakeview Ave Unit 48
- 4891 Eureka Ave Unit 25
- 17841 Buena Vista Ave
- 4845 Eisenhower Ct
- 5992 Organza Dr
- 17842 Caballo Dr
- 5335 Grandview Ave
- 18931 Gordon Ln
- 5371 Grandview Ave
- 17781 Lerene Dr
- 5245 Grandview Ave
- 5729 Grandview Ave
- 18279 Laurel View Dr
- 18299 Laurel View Dr
- 5266 Laurel View Cir
- 5242 Lakeview Ave
- 5286 Laurel View Cir
- 5281 Laurel View Cir
- 5212 Lakeview Ave
- 18259 Laurel View Dr
- 5202 Lakeview Ave
- 5232 Lakeview Ave
- 5222 Lakeview Ave
- 5192 Lakeview Ave
- 18451 Flora Dr
- 5296 Laurel View Cir
- 18249 Laurel View Dr
- 5291 Laurel View Cir
- 5172 Lakeview Ave
- 5184 Lakeview Ave
- 0 Tiki Torch Unit P796182
- 0 Tiki Torch Unit S693585