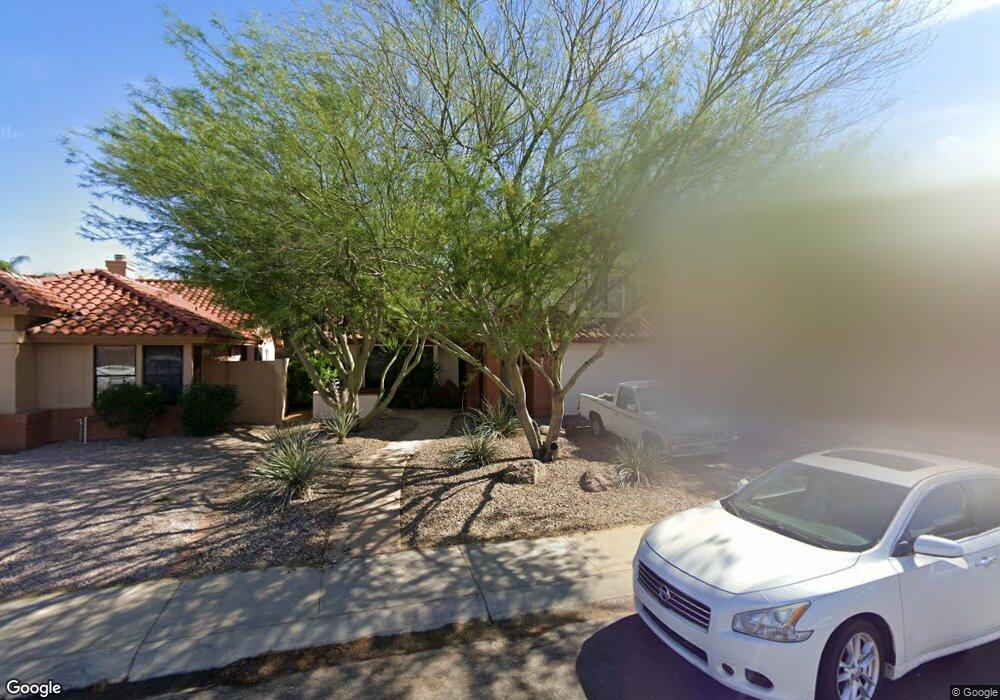
1829 E Redfield Rd Unit SHARP Phoenix, AZ 85022
Paradise Valley Village NeighborhoodEstimated Value: $504,939 - $566,000
4
Beds
3
Baths
1,910
Sq Ft
$281/Sq Ft
Est. Value
About This Home
This home is located at 1829 E Redfield Rd Unit SHARP, Phoenix, AZ 85022 and is currently estimated at $536,985, approximately $281 per square foot. 1829 E Redfield Rd Unit SHARP is a home located in Maricopa County with nearby schools including Hidden Hills Elementary School, Shea Middle School, and Shadow Mountain High School.
Ownership History
Date
Name
Owned For
Owner Type
Purchase Details
Closed on
Nov 30, 2010
Sold by
Thompson Julianne
Bought by
Mccabe Thomas S and Mccabe Debbie A
Current Estimated Value
Home Financials for this Owner
Home Financials are based on the most recent Mortgage that was taken out on this home.
Original Mortgage
$190,056
Outstanding Balance
$125,758
Interest Rate
4.25%
Mortgage Type
FHA
Estimated Equity
$411,227
Purchase Details
Closed on
Nov 20, 2001
Sold by
Schimke Jane M
Bought by
Thompson Julianne
Purchase Details
Closed on
Nov 14, 2001
Sold by
Rausch John F
Bought by
Thompson Julianne
Purchase Details
Closed on
Mar 20, 2001
Sold by
Schimke Jay S
Bought by
Schimke Jane M
Home Financials for this Owner
Home Financials are based on the most recent Mortgage that was taken out on this home.
Original Mortgage
$140,000
Interest Rate
7.06%
Create a Home Valuation Report for This Property
The Home Valuation Report is an in-depth analysis detailing your home's value as well as a comparison with similar homes in the area
Home Values in the Area
Average Home Value in this Area
Purchase History
| Date | Buyer | Sale Price | Title Company |
|---|---|---|---|
| Mccabe Thomas S | $195,000 | American Title Service Agenc | |
| Thompson Julianne | $197,000 | First American Title | |
| Thompson Julianne | -- | First American Title | |
| Schimke Jane M | -- | First American Title | |
| Schimke Jane M | -- | First American Title |
Source: Public Records
Mortgage History
| Date | Status | Borrower | Loan Amount |
|---|---|---|---|
| Open | Mccabe Thomas S | $190,056 | |
| Previous Owner | Schimke Jane M | $140,000 | |
| Closed | Schimke Jane M | $17,500 |
Source: Public Records
Tax History
| Year | Tax Paid | Tax Assessment Tax Assessment Total Assessment is a certain percentage of the fair market value that is determined by local assessors to be the total taxable value of land and additions on the property. | Land | Improvement |
|---|---|---|---|---|
| 2025 | $2,049 | $23,668 | -- | -- |
| 2024 | $1,951 | $22,541 | -- | -- |
| 2023 | $1,951 | $41,380 | $8,270 | $33,110 |
| 2022 | $1,933 | $32,980 | $6,590 | $26,390 |
| 2021 | $1,965 | $28,880 | $5,770 | $23,110 |
| 2020 | $1,898 | $27,850 | $5,570 | $22,280 |
| 2019 | $1,906 | $25,830 | $5,160 | $20,670 |
| 2018 | $1,837 | $25,910 | $5,180 | $20,730 |
| 2017 | $1,754 | $21,900 | $4,380 | $17,520 |
| 2016 | $1,726 | $21,220 | $4,240 | $16,980 |
| 2015 | $1,602 | $18,210 | $3,640 | $14,570 |
Source: Public Records
Map
Nearby Homes
- 1843 E Sheena Dr
- 1927 E Crocus Dr
- 1729 E Winchcomb Dr
- 13821 N 16th Way Unit 9
- 13630 N 18th St
- 14432 N 18th St
- 13619 N 18th St
- 1732 E Gelding Dr
- 1711 E Sharon Dr
- 2119 E Crocus Dr
- 1539 E Winged Foot Rd
- 13606 N 21st Place Unit 19
- 1916 E Claire Dr
- 13422 N 21st Place
- 1942 E Claire Dr
- 13402 N 21st Place Unit 5
- 13428 N 16th Place
- 14218 N 14th Place
- 14829 N 18th Place
- 13240 N 20th St
- 1829 E Redfield Rd Unit 3
- 1825 E Redfield Rd
- 1844 E Sheena Dr
- 1823 E Redfield Rd
- 1821 E Redfield Rd
- 1837 E Redfield Rd Unit 3
- 1838 E Sheena Dr
- 1850 E Sheena Dr
- 1830 E Redfield Rd
- 1832 E Sheena Dr
- 1834 E Redfield Rd
- 1826 E Redfield Rd
- 1817 E Redfield Rd
- 1901 E Redfield Rd
- 1838 E Redfield Rd
- 1822 E Redfield Rd
- 1826 E Sheena Dr
- 1856 E Sheena Dr
- 1813 E Redfield Rd
- 1905 E Redfield Rd
Your Personal Tour Guide
Ask me questions while you tour the home.