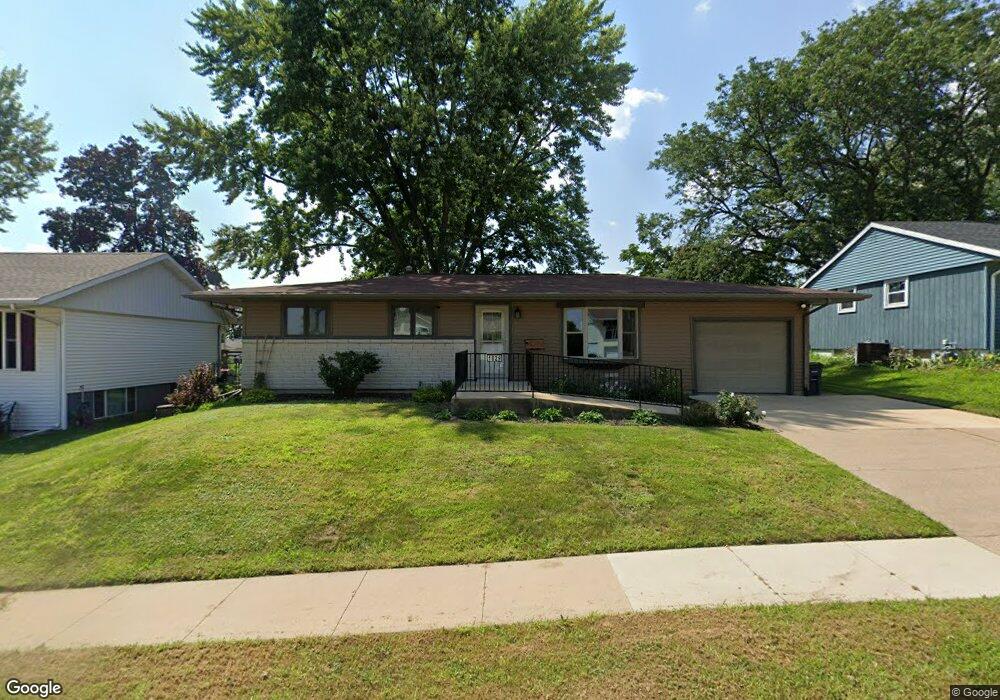
1829 Phyllrich Dr Dubuque, IA 52002
Estimated Value: $220,645 - $249,000
3
Beds
2
Baths
1,066
Sq Ft
$221/Sq Ft
Est. Value
About This Home
This home is located at 1829 Phyllrich Dr, Dubuque, IA 52002 and is currently estimated at $235,661, approximately $221 per square foot. 1829 Phyllrich Dr is a home located in Dubuque County with nearby schools including John Kennedy Elementary School, Eleanor Roosevelt Middle School, and Hempstead High School.
Ownership History
Date
Name
Owned For
Owner Type
Purchase Details
Closed on
Nov 16, 2018
Sold by
Poffenberger Susan Carol and Poffenberger Raymond Lynn
Bought by
Laufenberg Randy R and Laufenberg Victoria J
Current Estimated Value
Home Financials for this Owner
Home Financials are based on the most recent Mortgage that was taken out on this home.
Original Mortgage
$142,762
Interest Rate
4.7%
Mortgage Type
New Conventional
Purchase Details
Closed on
Dec 29, 2011
Sold by
Christensen Bridget and Christensen Kurt E
Bought by
Williams Susan C
Home Financials for this Owner
Home Financials are based on the most recent Mortgage that was taken out on this home.
Original Mortgage
$126,704
Interest Rate
3.99%
Mortgage Type
FHA
Purchase Details
Closed on
Sep 2, 2011
Sold by
Christensen Bridget
Bought by
Christensen Bridget and Sandidge Michael
Create a Home Valuation Report for This Property
The Home Valuation Report is an in-depth analysis detailing your home's value as well as a comparison with similar homes in the area
Home Values in the Area
Average Home Value in this Area
Purchase History
| Date | Buyer | Sale Price | Title Company |
|---|---|---|---|
| Laufenberg Randy R | $151,000 | None Available | |
| Williams Susan C | $130,000 | None Available | |
| Christensen Bridget | -- | None Available |
Source: Public Records
Mortgage History
| Date | Status | Borrower | Loan Amount |
|---|---|---|---|
| Previous Owner | Laufenberg Randy R | $142,762 | |
| Previous Owner | Williams Susan C | $126,704 |
Source: Public Records
Tax History Compared to Growth
Tax History
| Year | Tax Paid | Tax Assessment Tax Assessment Total Assessment is a certain percentage of the fair market value that is determined by local assessors to be the total taxable value of land and additions on the property. | Land | Improvement |
|---|---|---|---|---|
| 2025 | $2,308 | $211,100 | $39,900 | $171,200 |
| 2024 | $2,308 | $192,800 | $34,700 | $158,100 |
| 2023 | $2,328 | $192,800 | $34,700 | $158,100 |
| 2022 | $2,354 | $154,740 | $31,210 | $123,530 |
| 2021 | $2,354 | $154,740 | $31,210 | $123,530 |
| 2020 | $2,308 | $141,970 | $31,210 | $110,760 |
| 2019 | $2,378 | $141,970 | $31,210 | $110,760 |
| 2018 | $2,338 | $136,460 | $31,210 | $105,250 |
| 2017 | $2,304 | $136,460 | $31,210 | $105,250 |
| 2016 | $2,304 | $127,770 | $31,210 | $96,560 |
| 2015 | $2,252 | $127,770 | $31,210 | $96,560 |
| 2014 | $2,122 | $124,050 | $31,210 | $92,840 |
Source: Public Records
Map
Nearby Homes
- 1754 Vizaleea Dr
- 3631 Keymeer Dr
- 3660 Hillcrest Rd
- 2090 Key Largo Dr
- Lot Hillcrest Rd
- 3519 Hillcrest Rd
- 3424 Glencove Ln
- 3427 Crestwood Dr
- 2145 Saint John Dr
- 3455 Daniels St
- 3428 Crestwood Dr
- 2023 Clifford St
- 1693 Butterfield Rd
- 1555 Donovan Dr
- 3080 Saint Anne Dr
- 3575 Lisa Ct
- 3130 Ideal Ln
- 1790 Horizon Ct
- 0 Associates Dr
- 3462 Asbury Rd
- 1813 Phyllrich Dr
- 1830 Hansel Dr
- 1814 Hansel Dr
- 1849 Phyllrich Dr
- 1844 Hansel Dr
- 1824 Phyllrich Dr
- 1836 Phyllrich Dr
- 1810 Phyllrich Dr
- 1852 Hansel Dr
- 1859 Phyllrich Dr
- 3560 Keymont Dr
- 3556 Keymont Dr
- 3566 Keymont Dr
- 3550 Keymont Dr
- 1856 Phyllrich Dr
- 1860 Hansel Dr
- 1817 Hansel Dr
- 1831 Norland Dr
- 1819 Norland Dr
- 1833 Hansel Dr