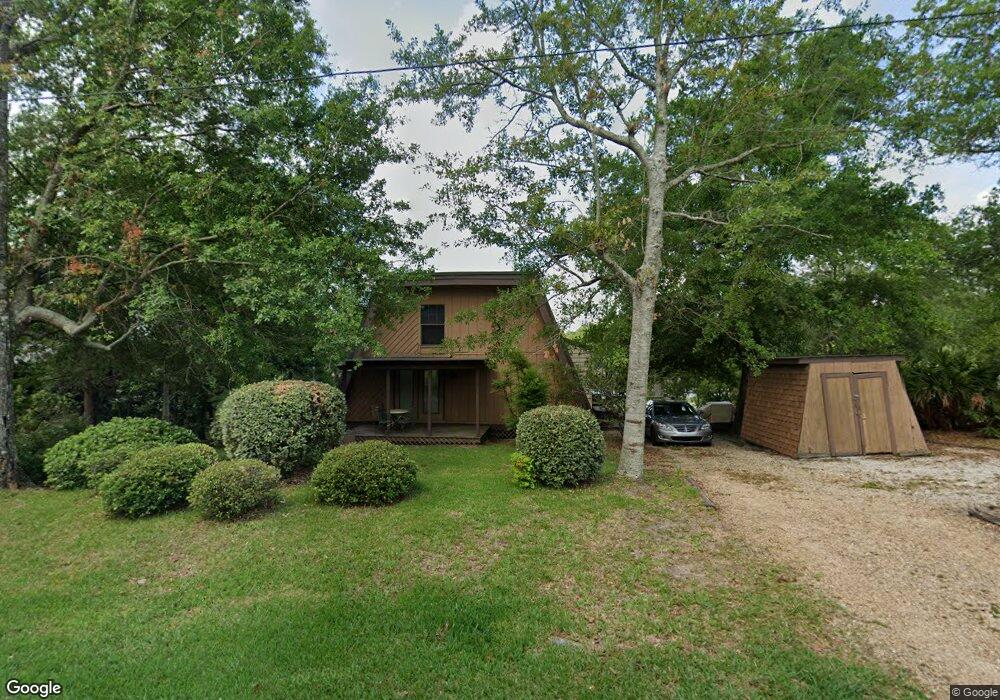
1829 Tradewinds Dr Gautier, MS 39553
Estimated Value: $230,000 - $282,000
3
Beds
2
Baths
1,926
Sq Ft
$136/Sq Ft
Est. Value
About This Home
This home is located at 1829 Tradewinds Dr, Gautier, MS 39553 and is currently estimated at $262,170, approximately $136 per square foot. 1829 Tradewinds Dr is a home located in Jackson County with nearby schools including College Park Elementary School, Gautier Middle School, and Singing River Elementary School.
Ownership History
Date
Name
Owned For
Owner Type
Purchase Details
Closed on
Aug 15, 2023
Sold by
Jesse And Shelia Millwood Living Trust
Bought by
Green Hacy E
Current Estimated Value
Home Financials for this Owner
Home Financials are based on the most recent Mortgage that was taken out on this home.
Original Mortgage
$170,000
Outstanding Balance
$154,753
Interest Rate
6.24%
Mortgage Type
New Conventional
Estimated Equity
$107,417
Purchase Details
Closed on
Nov 30, 2022
Sold by
Millwood Jesse E
Bought by
Jesse And Shelia Millwood Living Trust
Purchase Details
Closed on
May 3, 2013
Sold by
Green James L and Green Barbara M
Bought by
Millwood Jesse E and Millwood Shelia
Purchase Details
Closed on
Mar 29, 2010
Sold by
Green James L and Green Barbara M
Bought by
Millwood Jesse E and Millwood Sheila
Home Financials for this Owner
Home Financials are based on the most recent Mortgage that was taken out on this home.
Original Mortgage
$100,000
Interest Rate
5.02%
Mortgage Type
Purchase Money Mortgage
Create a Home Valuation Report for This Property
The Home Valuation Report is an in-depth analysis detailing your home's value as well as a comparison with similar homes in the area
Home Values in the Area
Average Home Value in this Area
Purchase History
| Date | Buyer | Sale Price | Title Company |
|---|---|---|---|
| Green Hacy E | -- | None Listed On Document | |
| Jesse And Shelia Millwood Living Trust | -- | -- | |
| Jesse And Shelia Millwood Living Trust | -- | None Listed On Document | |
| Millwood Jesse E | -- | -- | |
| Millwood Jesse E | -- | -- |
Source: Public Records
Mortgage History
| Date | Status | Borrower | Loan Amount |
|---|---|---|---|
| Open | Green Hacy E | $170,000 | |
| Previous Owner | Millwood Jesse E | $100,000 |
Source: Public Records
Tax History Compared to Growth
Tax History
| Year | Tax Paid | Tax Assessment Tax Assessment Total Assessment is a certain percentage of the fair market value that is determined by local assessors to be the total taxable value of land and additions on the property. | Land | Improvement |
|---|---|---|---|---|
| 2024 | $1,746 | $14,082 | $3,668 | $10,414 |
| 2023 | $1,746 | $21,123 | $5,502 | $15,621 |
| 2022 | $699 | $12,360 | $0 | $0 |
| 2021 | $699 | $12,360 | $12,360 | $0 |
| 2020 | $707 | $12,360 | $3,335 | $9,025 |
| 2019 | $713 | $12,360 | $3,335 | $9,025 |
| 2018 | $766 | $12,716 | $3,335 | $9,381 |
| 2017 | $721 | $12,716 | $3,335 | $9,381 |
| 2016 | $1,416 | $12,716 | $3,335 | $9,381 |
| 2015 | $2,374 | $117,290 | $33,350 | $83,940 |
| 2014 | $2,392 | $17,594 | $5,003 | $12,591 |
| 2013 | $2,056 | $15,544 | $2,993 | $12,551 |
Source: Public Records
Map
Nearby Homes
- Tbd Tradewinds Dr
- Oooo Seacrest Dr
- 0 Seacrest Dr
- 3328 Mangrove St
- 0 Sandpiper
- 3313 Neptune Dr
- 2000 Plover Ln
- 1701 Lucina Cove
- 2000 Heron Ln
- 2023 Sandpiper Ln
- 1500 Barracuda Dr
- 0 Gulf View Place
- 2405 Santa Cruz St
- 2212 Starfish Rd
- 1901 Porpoise
- 0 Porpoise Unit 4121854
- 2925 Graveline Rd
- 3005 Robalo
- 0 Amberjack Dr
- 0 Marlin Cove
- 1825 Tradewinds Dr
- 1905 Tradewinds Dr
- 3321 Ebbtide St
- 1904 Tradewinds Dr
- 1913 Tradewinds Dr
- 3320 Ebbtide St
- 1820 Tradewinds Dr
- Lot 391 Tradewinds Dr
- Lot 398 Ebbtide
- 1917 Tradewinds Dr
- 3312 Ebbtide St
- 1801 Tradewinds Dr
- 3313 Albatross Dr
- 390 & 391 Tradewinds Dr
- Lot 390 Tradewinds Dr
- 3305 Ebbtide St
- 1821 Seacrest Dr
- 3306 Ebbtide St
- 0 Albatross Dr
- 1819 Seacrest Dr