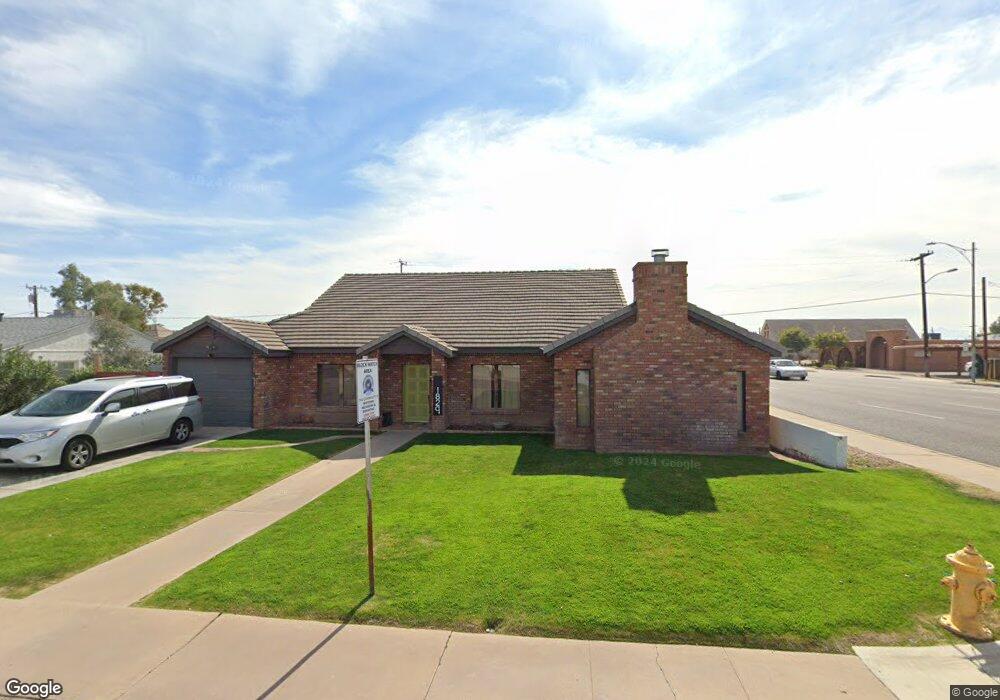
1829 W Weldon Ave Phoenix, AZ 85015
North Encanto NeighborhoodEstimated Value: $414,000 - $646,000
4
Beds
2
Baths
2,418
Sq Ft
$225/Sq Ft
Est. Value
About This Home
This home is located at 1829 W Weldon Ave, Phoenix, AZ 85015 and is currently estimated at $543,453, approximately $224 per square foot. 1829 W Weldon Ave is a home located in Maricopa County with nearby schools including Encanto Elementary School, Clarendon Elementary School, and Phoenix Coding Academy.
Ownership History
Date
Name
Owned For
Owner Type
Purchase Details
Closed on
Dec 30, 2024
Sold by
Rideau Christopher A and Rideau Joanne V
Bought by
Rideau Adam and Rideau Sabrina
Current Estimated Value
Home Financials for this Owner
Home Financials are based on the most recent Mortgage that was taken out on this home.
Original Mortgage
$462,469
Outstanding Balance
$459,239
Interest Rate
6.78%
Mortgage Type
FHA
Estimated Equity
$84,214
Purchase Details
Closed on
Mar 6, 1996
Sold by
Benites Caroline
Bought by
Rideau Christopher A and Rideau Joanne
Home Financials for this Owner
Home Financials are based on the most recent Mortgage that was taken out on this home.
Original Mortgage
$78,950
Interest Rate
7.41%
Mortgage Type
FHA
Create a Home Valuation Report for This Property
The Home Valuation Report is an in-depth analysis detailing your home's value as well as a comparison with similar homes in the area
Home Values in the Area
Average Home Value in this Area
Purchase History
| Date | Buyer | Sale Price | Title Company |
|---|---|---|---|
| Rideau Adam | $471,000 | American Title Service Agency | |
| Rideau Christopher A | $80,000 | First American Title |
Source: Public Records
Mortgage History
| Date | Status | Borrower | Loan Amount |
|---|---|---|---|
| Open | Rideau Adam | $462,469 | |
| Previous Owner | Rideau Christopher A | $78,950 |
Source: Public Records
Tax History
| Year | Tax Paid | Tax Assessment Tax Assessment Total Assessment is a certain percentage of the fair market value that is determined by local assessors to be the total taxable value of land and additions on the property. | Land | Improvement |
|---|---|---|---|---|
| 2025 | $1,227 | $10,743 | -- | -- |
| 2024 | $1,141 | $10,231 | -- | -- |
| 2023 | $1,141 | $36,710 | $7,340 | $29,370 |
| 2022 | $1,136 | $30,320 | $6,060 | $24,260 |
| 2021 | $1,169 | $23,020 | $4,600 | $18,420 |
| 2020 | $1,138 | $22,000 | $4,400 | $17,600 |
| 2019 | $1,085 | $18,370 | $3,670 | $14,700 |
| 2018 | $1,046 | $17,470 | $3,490 | $13,980 |
| 2017 | $951 | $15,250 | $3,050 | $12,200 |
| 2016 | $916 | $14,050 | $2,810 | $11,240 |
| 2015 | $853 | $10,910 | $2,180 | $8,730 |
Source: Public Records
Map
Nearby Homes
- 1932 W Whitton Ave
- 1941 W Whitton Ave
- 1941 W Mitchell Dr
- 1841 W Fairmount Ave
- 2028 W Clarendon Ave
- 1829 W Fairmount Ave
- 1802 W Indianola Ave
- 1712 W Weldon Ave
- 3640 N 21st Ave
- 1729 W Fairmount Ave
- 3828 N 21st Ave
- 1831 W Mulberry Dr Unit 220
- 3327 N 18th Ave
- 2134 W Mitchell Dr
- 3321 N 17th Dr
- 2145 W Indianola Ave
- 3413 N 16th Dr
- 2147 W Osborn Rd
- 4115 N 18th Dr
- 1607 W Whitton Ave
- 1827 W Weldon Ave
- 1901 W Weldon Ave Unit 2
- 1901 W Weldon Ave
- 1901 W Weldon Ave Unit 2, 3
- 1901 W Weldon Ave Unit 3
- 1821 W Weldon Ave
- 1828 W Weldon Ave
- 3600 N 19th Ave
- 1907 W Weldon Ave
- 1817 W Weldon Ave
- 1820 W Weldon Ave
- 1902 W Weldon Ave
- 1908 W Whitton Ave
- 1824 W Whitton Ave
- 1911 W Weldon Ave
- 1908 W Weldon Ave
- 1816 W Weldon Ave
- 1813 W Weldon Ave
- 1912 W Whitton Ave
- 1812 W Whitton Ave
Your Personal Tour Guide
Ask me questions while you tour the home.