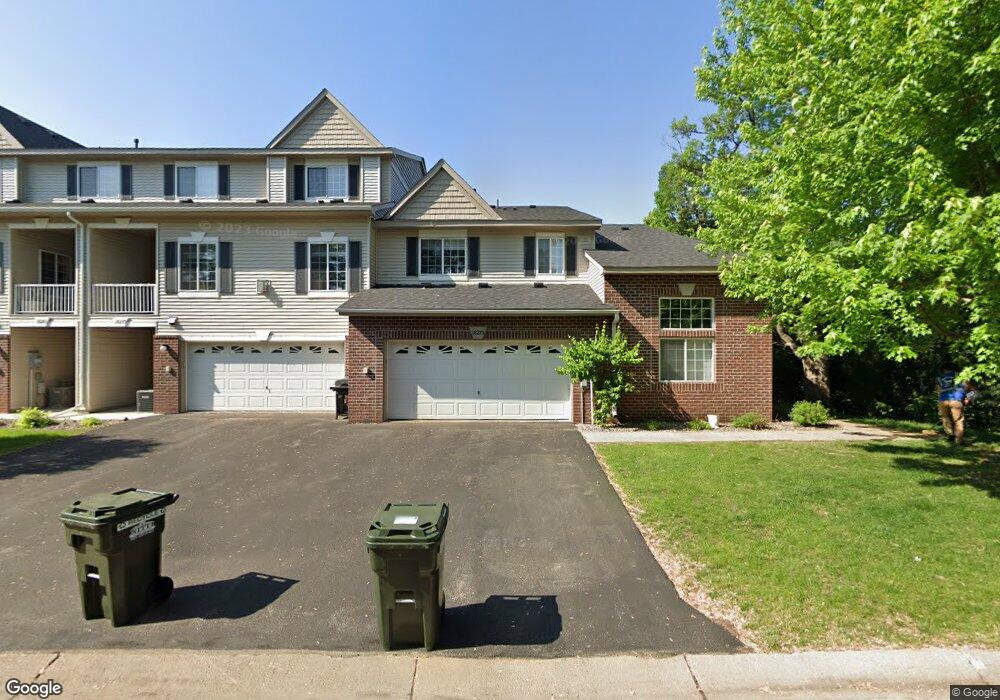
18291 Key West Ct Unit 216H Lakeville, MN 55044
Estimated Value: $298,000 - $329,000
3
Beds
3
Baths
1,809
Sq Ft
$175/Sq Ft
Est. Value
About This Home
This home is located at 18291 Key West Ct Unit 216H, Lakeville, MN 55044 and is currently estimated at $316,142, approximately $174 per square foot. 18291 Key West Ct Unit 216H is a home located in Dakota County with nearby schools including Impact Academy at Orchard Lake Elementary School, Kenwood Trail Middle School, and Lakeville South High School.
Ownership History
Date
Name
Owned For
Owner Type
Purchase Details
Closed on
Feb 26, 2021
Sold by
Johnson Becki
Bought by
Solinger Dean and Solinger Patricia
Current Estimated Value
Home Financials for this Owner
Home Financials are based on the most recent Mortgage that was taken out on this home.
Original Mortgage
$200,000
Outstanding Balance
$179,286
Interest Rate
2.7%
Mortgage Type
New Conventional
Estimated Equity
$136,856
Purchase Details
Closed on
Jun 5, 2018
Sold by
Marks Laura C
Bought by
Johnson Becki
Home Financials for this Owner
Home Financials are based on the most recent Mortgage that was taken out on this home.
Original Mortgage
$99,150
Interest Rate
4.5%
Mortgage Type
New Conventional
Purchase Details
Closed on
Sep 26, 2007
Sold by
Katherine Kinderwest Craig S and Katherine Kinderwest
Bought by
Marks Laura C
Create a Home Valuation Report for This Property
The Home Valuation Report is an in-depth analysis detailing your home's value as well as a comparison with similar homes in the area
Home Values in the Area
Average Home Value in this Area
Purchase History
| Date | Buyer | Sale Price | Title Company |
|---|---|---|---|
| Solinger Dean | $305,000 | Dca Title | |
| Johnson Becki | $268,000 | First American Title Insuran | |
| Marks Laura C | $237,855 | -- | |
| Solinger Dean Dean | $305,000 | -- |
Source: Public Records
Mortgage History
| Date | Status | Borrower | Loan Amount |
|---|---|---|---|
| Open | Solinger Dean | $200,000 | |
| Previous Owner | Johnson Becki | $99,150 | |
| Closed | Solinger Dean Dean | $244,000 |
Source: Public Records
Tax History Compared to Growth
Tax History
| Year | Tax Paid | Tax Assessment Tax Assessment Total Assessment is a certain percentage of the fair market value that is determined by local assessors to be the total taxable value of land and additions on the property. | Land | Improvement |
|---|---|---|---|---|
| 2024 | $3,294 | $310,100 | $75,400 | $234,700 |
| 2023 | $3,294 | $308,800 | $75,100 | $233,700 |
| 2022 | $3,012 | $313,100 | $74,800 | $238,300 |
| 2021 | $2,818 | $266,200 | $65,100 | $201,100 |
| 2020 | $2,824 | $242,900 | $62,000 | $180,900 |
| 2019 | $2,470 | $231,600 | $59,000 | $172,600 |
| 2018 | $2,334 | $212,200 | $54,600 | $157,600 |
| 2017 | $2,192 | $198,800 | $50,600 | $148,200 |
| 2016 | $2,197 | $186,600 | $48,200 | $138,400 |
| 2015 | $1,942 | $157,761 | $40,829 | $116,932 |
| 2014 | -- | $145,226 | $38,779 | $106,447 |
| 2013 | -- | $131,165 | $33,449 | $97,716 |
Source: Public Records
Map
Nearby Homes
- 18318 Kerrville Trail Unit 610
- 17829 Ketchikan Trail
- 17783 Ketchikan Ct
- 18020 Kenrick Ave
- 17753 Ketchikan Trail
- 18411 Lansford Path
- 17854 Lanesboro Ct
- 11635 177th St W
- 17702 Layton Ct
- 18120 Jurel Cir
- 18720 Kanabec Ct
- 17655 Empire Trail
- 18282 Justice Way
- 18316 Justice Way
- Lot 3 Block 1 Kenrick Ave
- 18928 Katrine Ct
- 18803 Orchard Trail
- 18581 Joplin Ave
- 18053 Judicial Way S
- 18241 Justice Way
- 18291 Key West Ct
- 18295 Key West Ct
- 18295 Key West Ct Unit 216G
- 18295 Key West Ct Unit 216G
- 18275 Key West Ct
- 18279 Key West Ct Unit 216C
- 18279 Key West Ct
- 18299 Key West Ct
- 18283 Key West Ct Unit 216B
- 18283 Key West Ct
- 18283 Key West Ct Unit 216B
- 18279 Key Ct W Unit 216C
- 18303 Key West Ct
- 18303 Key West Ct Unit 216E
- 18287 Key West Ct
- 18126 Lake Forest Cir
- 18138 Lake Forest Cir
- 18309 Key West Ct
- 18309 Key West Ct Unit 316D
- 18359 Kerrville Trail