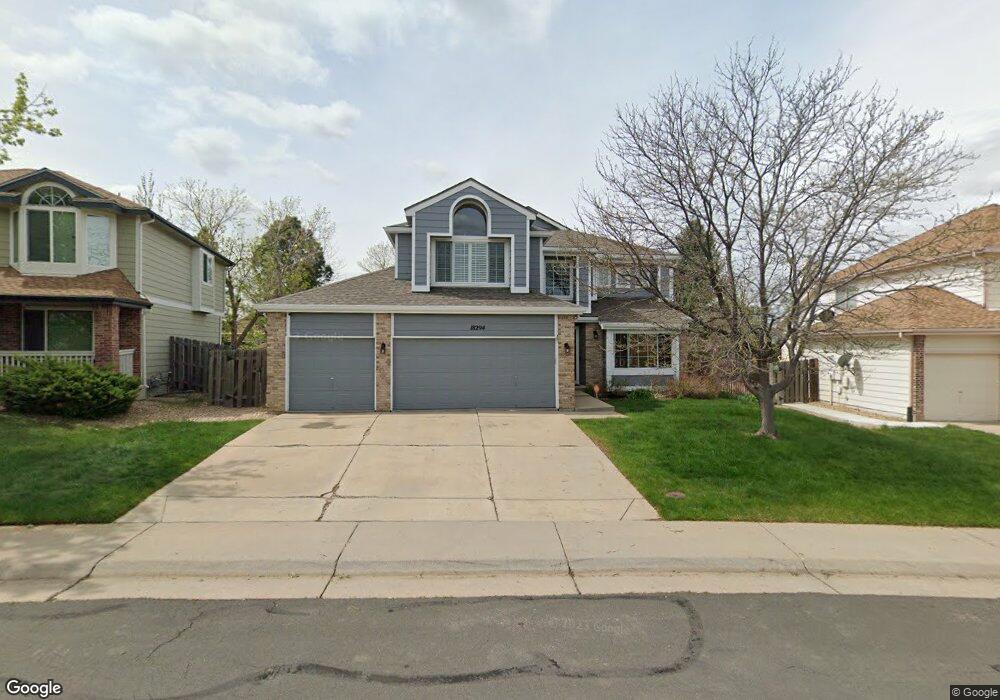
18294 E Wesley Place Aurora, CO 80013
Lakeshore NeighborhoodEstimated Value: $506,000 - $573,000
3
Beds
4
Baths
2,143
Sq Ft
$252/Sq Ft
Est. Value
About This Home
This home is located at 18294 E Wesley Place, Aurora, CO 80013 and is currently estimated at $540,328, approximately $252 per square foot. 18294 E Wesley Place is a home located in Arapahoe County with nearby schools including Vassar Elementary School, Columbia Middle School, and Rangeview High School.
Ownership History
Date
Name
Owned For
Owner Type
Purchase Details
Closed on
Feb 8, 2017
Sold by
Pryor Clifford Lewis and Pryor Loretta Lorraine
Bought by
Pryor Clifford Lewis and Pryor Loretta Lorraine
Current Estimated Value
Purchase Details
Closed on
Oct 14, 2013
Sold by
Pryor Clifford L and Pryor Loretta L
Bought by
Pryor Clifford Lewis and Pryor Loretta Lorraine
Purchase Details
Closed on
Apr 1, 1993
Sold by
Padgett Gary R Padgett Lorraine M
Bought by
Pryor Clifford L Pryor Loretta L
Purchase Details
Closed on
Oct 30, 1992
Sold by
Conversion Arapco
Bought by
Padgett Gary R Padgett Lorraine M
Purchase Details
Closed on
Apr 4, 1991
Bought by
Conversion Arapco
Create a Home Valuation Report for This Property
The Home Valuation Report is an in-depth analysis detailing your home's value as well as a comparison with similar homes in the area
Home Values in the Area
Average Home Value in this Area
Purchase History
| Date | Buyer | Sale Price | Title Company |
|---|---|---|---|
| Pryor Clifford Lewis | -- | None Available | |
| Pryor Clifford Lewis | -- | None Available | |
| Pryor Clifford L Pryor Loretta L | -- | -- | |
| Padgett Gary R Padgett Lorraine M | -- | -- | |
| Conversion Arapco | -- | -- |
Source: Public Records
Tax History
| Year | Tax Paid | Tax Assessment Tax Assessment Total Assessment is a certain percentage of the fair market value that is determined by local assessors to be the total taxable value of land and additions on the property. | Land | Improvement |
|---|---|---|---|---|
| 2025 | $3,316 | $31,831 | -- | -- |
| 2024 | $3,216 | $34,599 | -- | -- |
| 2023 | $3,216 | $34,599 | $0 | $0 |
| 2022 | $2,523 | $25,131 | $0 | $0 |
| 2021 | $2,605 | $25,131 | $0 | $0 |
| 2020 | $2,750 | $26,412 | $0 | $0 |
| 2019 | $2,735 | $26,412 | $0 | $0 |
| 2018 | $2,298 | $21,737 | $0 | $0 |
| 2017 | $1,999 | $21,737 | $0 | $0 |
| 2016 | $2,001 | $21,301 | $0 | $0 |
| 2015 | $1,932 | $21,301 | $0 | $0 |
| 2014 | -- | $15,220 | $0 | $0 |
| 2013 | -- | $17,440 | $0 | $0 |
Source: Public Records
Map
Nearby Homes
- 2438 S Zeno St
- 2509 S Truckee Way
- 18291 E Caspian Place
- 18664 E Lasalle Place
- 2585 S Truckee Way
- 17593 E Wesley Place
- 18761 E Water Dr Unit C
- 2521 S Bahama Cir Unit F
- 18668 E Vassar Dr
- 19003 E Harvard Dr
- 18727 E Yale Cir Unit B
- 19117 E Harvard Dr
- 18766 E Yale Cir Unit A
- 2167 S Truckee St
- 17538 E Baker Place
- 17516 E Wesley Place
- 19147 E Dickenson Dr
- 18522 E Linvale Place
- 2063 S Cathay Way
- 2082 S Cathay Way
- 18204 E Wesley Place
- 18306 E Wesley Place
- 18205 E Dickenson Place
- 18193 E Dickenson Place
- 18295 E Dickenson Place
- 2422 S Waco Ct
- 2407 S Zeno St
- 18305 E Wesley Place
- 18293 E Wesley Place
- 2402 S Waco Ct
- 2442 S Waco Ct
- 2427R S Zeno St
- 2427 S Zeno St
- 18307 E Dickenson Place
- 18203 E Wesley Place
- 18395 E Wesley Place
- 2437 S Zeno St
- 2390 S Waco Ct
- 18194 E Dickenson Place
- 18206 E Dickenson Place
Your Personal Tour Guide
Ask me questions while you tour the home.