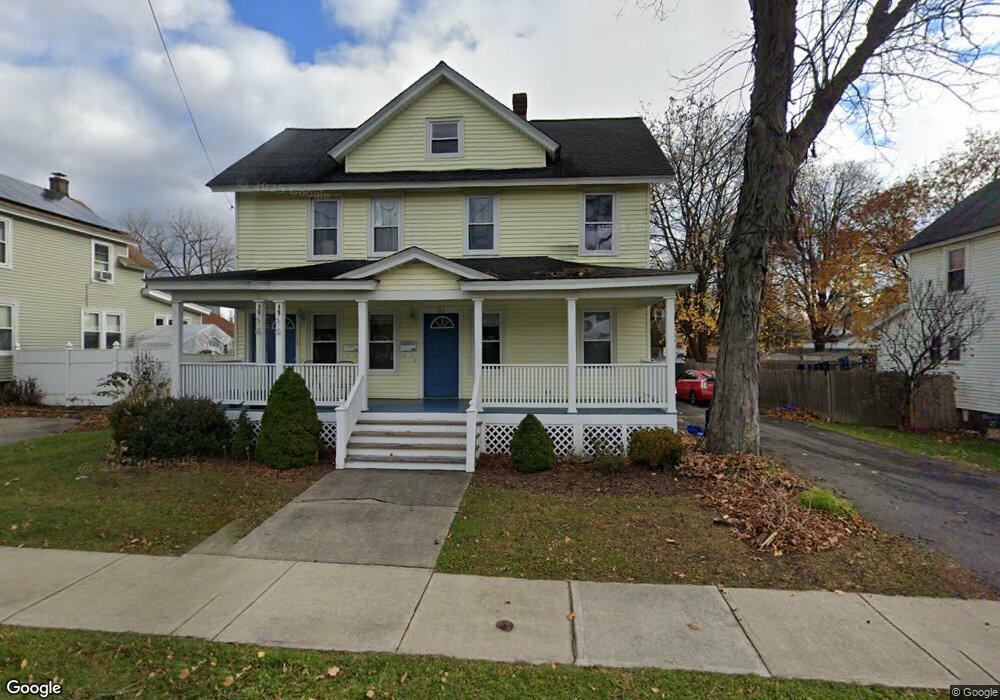
183 Elm St Unit 185 Greenfield, MA 01301
Estimated Value: $306,000 - $337,939
4
Beds
2
Baths
2,052
Sq Ft
$154/Sq Ft
Est. Value
About This Home
This home is located at 183 Elm St Unit 185, Greenfield, MA 01301 and is currently estimated at $316,485, approximately $154 per square foot. 183 Elm St Unit 185 is a home located in Franklin County with nearby schools including Cornerstone Christian School and Holy Trinity School.
Ownership History
Date
Name
Owned For
Owner Type
Purchase Details
Closed on
Dec 4, 2003
Sold by
Mcgrath Michael J and Mendyk Michael P
Bought by
Gisick Rodney D
Current Estimated Value
Home Financials for this Owner
Home Financials are based on the most recent Mortgage that was taken out on this home.
Original Mortgage
$113,000
Interest Rate
6.03%
Mortgage Type
Purchase Money Mortgage
Purchase Details
Closed on
Apr 18, 2003
Sold by
Holewa Barbara A and Holewa Barbara
Bought by
Mcgrath Michael J and Mendyk Michael P
Create a Home Valuation Report for This Property
The Home Valuation Report is an in-depth analysis detailing your home's value as well as a comparison with similar homes in the area
Home Values in the Area
Average Home Value in this Area
Purchase History
| Date | Buyer | Sale Price | Title Company |
|---|---|---|---|
| Gisick Rodney D | $161,500 | -- | |
| Gisick Rodney D | $161,500 | -- | |
| Mcgrath Michael J | $47,000 | -- | |
| Mcgrath Michael J | $47,000 | -- |
Source: Public Records
Mortgage History
| Date | Status | Borrower | Loan Amount |
|---|---|---|---|
| Open | Mcgrath Michael J | $290,000 | |
| Closed | Mcgrath Michael J | $314,000 | |
| Closed | Gisick Rodney D | $113,000 |
Source: Public Records
Tax History Compared to Growth
Tax History
| Year | Tax Paid | Tax Assessment Tax Assessment Total Assessment is a certain percentage of the fair market value that is determined by local assessors to be the total taxable value of land and additions on the property. | Land | Improvement |
|---|---|---|---|---|
| 2025 | $5,156 | $263,600 | $45,900 | $217,700 |
| 2024 | $5,259 | $257,900 | $41,900 | $216,000 |
| 2023 | $4,549 | $231,500 | $41,900 | $189,600 |
| 2022 | $4,444 | $199,100 | $39,900 | $159,200 |
| 2021 | $4,333 | $186,600 | $42,900 | $143,700 |
| 2020 | $4,187 | $182,600 | $38,900 | $143,700 |
| 2019 | $3,971 | $177,600 | $33,900 | $143,700 |
| 2018 | $3,901 | $173,900 | $33,300 | $140,600 |
| 2017 | $3,779 | $173,900 | $33,300 | $140,600 |
| 2016 | $3,695 | $169,400 | $29,000 | $140,400 |
| 2015 | $3,606 | $160,200 | $29,300 | $130,900 |
| 2014 | $3,291 | $160,300 | $29,300 | $131,000 |
Source: Public Records
Map
Nearby Homes
- 23-25 Alden St
- 192 Wells St
- 116-120 Elm St
- 36 West St
- 311 Chapman St
- 75 Phillips St
- 24 Cypress St
- 86-88 Conway St
- 254 Davis St
- 59-61 Conway St
- 306 Davis St
- 46 Colrain St
- 11 Colrain St
- 11 Conway St
- 75 School St
- 6 Keegan Ln Unit E
- 35 Shattuck St Unit 37
- 35-37 Shattuck St
- 22 Princeton Terrace Unit 22
- 83 Newton St