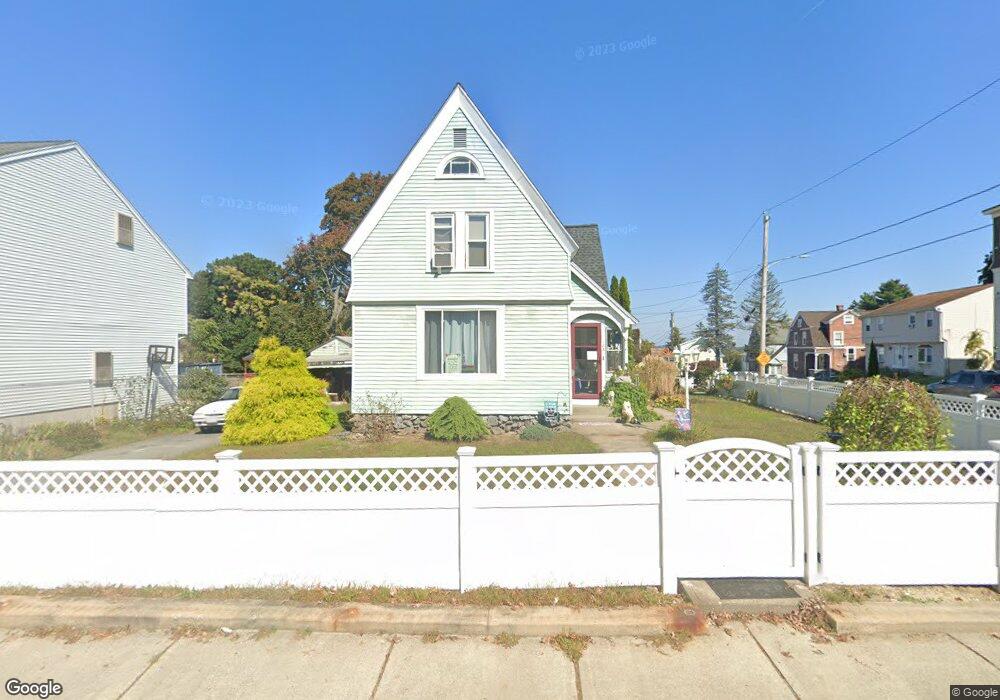
183 Ferry St Lawrence, MA 01841
Prospect Hill-Back Bay NeighborhoodEstimated Value: $431,000 - $564,000
3
Beds
1
Bath
1,205
Sq Ft
$419/Sq Ft
Est. Value
About This Home
This home is located at 183 Ferry St, Lawrence, MA 01841 and is currently estimated at $504,300, approximately $418 per square foot. 183 Ferry St is a home located in Essex County with nearby schools including School For Exceptional Studies, Community Day Charter Public School - Gateway, and Esperanza Academy School of Hope.
Ownership History
Date
Name
Owned For
Owner Type
Purchase Details
Closed on
Feb 11, 2002
Sold by
Gattenby Rt and Mcgregor Susan J
Bought by
Chubb Joan M
Current Estimated Value
Home Financials for this Owner
Home Financials are based on the most recent Mortgage that was taken out on this home.
Original Mortgage
$125,000
Outstanding Balance
$51,942
Interest Rate
7.13%
Mortgage Type
Purchase Money Mortgage
Estimated Equity
$452,358
Create a Home Valuation Report for This Property
The Home Valuation Report is an in-depth analysis detailing your home's value as well as a comparison with similar homes in the area
Home Values in the Area
Average Home Value in this Area
Purchase History
| Date | Buyer | Sale Price | Title Company |
|---|---|---|---|
| Chubb Joan M | $145,000 | -- |
Source: Public Records
Mortgage History
| Date | Status | Borrower | Loan Amount |
|---|---|---|---|
| Open | Chubb Joan M | $125,000 | |
| Previous Owner | Chubb Joan M | $95,000 |
Source: Public Records
Tax History
| Year | Tax Paid | Tax Assessment Tax Assessment Total Assessment is a certain percentage of the fair market value that is determined by local assessors to be the total taxable value of land and additions on the property. | Land | Improvement |
|---|---|---|---|---|
| 2025 | $3,729 | $423,700 | $146,700 | $277,000 |
| 2024 | $3,274 | $353,900 | $127,000 | $226,900 |
| 2023 | $3,578 | $352,200 | $127,000 | $225,200 |
| 2022 | $3,228 | $282,200 | $113,300 | $168,900 |
| 2021 | $3,155 | $257,100 | $113,300 | $143,800 |
| 2020 | $3,175 | $255,400 | $111,600 | $143,800 |
| 2019 | $3,049 | $222,900 | $89,100 | $133,800 |
| 2018 | $2,811 | $196,300 | $85,000 | $111,300 |
| 2017 | $2,718 | $177,200 | $78,400 | $98,800 |
| 2016 | $2,634 | $169,800 | $70,100 | $99,700 |
| 2015 | $2,356 | $155,800 | $56,100 | $99,700 |
Source: Public Records
Map
Nearby Homes
- 39 Swan Ave
- 14 Court St
- 12 Annette St
- 106 Leroy Ave
- 18 Erhardt Terrace
- 5 Kendrick St
- 264 E Haverhill St Unit 2
- 7 Erhardt Terrace
- 25-27 Bicknell Ave
- 2 Leslie St
- 32 Josephine Ave
- 192 Union St
- 65 Arthur St
- 129-131 Lexington St
- 80-82 Haverhill St
- 89 Newbury St Unit 89B
- 68 Ashford St
- 91 Summer St Unit 2
- 131A Lawrence St Unit 40
- 37 Albion St
Your Personal Tour Guide
Ask me questions while you tour the home.