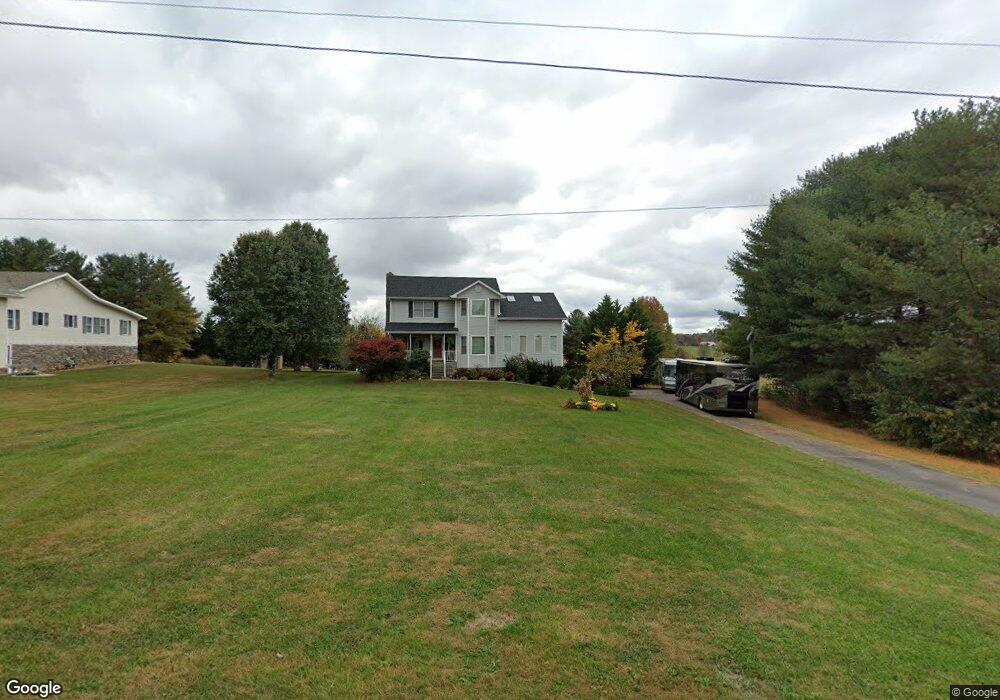
183 Harmony Acres Dr E Jonesborough, TN 37659
Estimated Value: $371,000 - $487,000
3
Beds
3
Baths
2,580
Sq Ft
$171/Sq Ft
Est. Value
About This Home
This home is located at 183 Harmony Acres Dr E, Jonesborough, TN 37659 and is currently estimated at $440,000, approximately $170 per square foot. 183 Harmony Acres Dr E is a home located in Washington County with nearby schools including Ridgeview Elementary School and Daniel Boone High School.
Ownership History
Date
Name
Owned For
Owner Type
Purchase Details
Closed on
Mar 27, 2014
Sold by
Brock Glenn Thomas
Bought by
Brock Melissa L
Current Estimated Value
Purchase Details
Closed on
Jan 30, 2004
Sold by
Wilkerson William
Bought by
Brock Glenn Thomas
Home Financials for this Owner
Home Financials are based on the most recent Mortgage that was taken out on this home.
Original Mortgage
$121,600
Interest Rate
5.85%
Purchase Details
Closed on
Jan 29, 2004
Sold by
Wilkerson William
Bought by
Brock Glenn Thomas
Home Financials for this Owner
Home Financials are based on the most recent Mortgage that was taken out on this home.
Original Mortgage
$121,600
Interest Rate
5.85%
Purchase Details
Closed on
Oct 9, 2001
Sold by
Ireson R Michelle
Bought by
Wilkerson William
Purchase Details
Closed on
Apr 16, 1996
Sold by
Adams Roger Kyle
Bought by
Ireson R Michelle
Purchase Details
Closed on
Jan 27, 1990
Bought by
Adams Roger Kyle and Adams Cindy Eileen
Create a Home Valuation Report for This Property
The Home Valuation Report is an in-depth analysis detailing your home's value as well as a comparison with similar homes in the area
Home Values in the Area
Average Home Value in this Area
Purchase History
| Date | Buyer | Sale Price | Title Company |
|---|---|---|---|
| Brock Melissa L | -- | -- | |
| Brock Glenn Thomas | $152,000 | -- | |
| Brock Glenn Thomas | $152,000 | -- | |
| Wilkerson William | $145,000 | -- | |
| Ireson R Michelle | $134,900 | -- | |
| Adams Roger Kyle | $5,000 | -- |
Source: Public Records
Mortgage History
| Date | Status | Borrower | Loan Amount |
|---|---|---|---|
| Previous Owner | Adams Roger Kyle | $121,600 | |
| Previous Owner | Adams Roger Kyle | $30,400 |
Source: Public Records
Tax History Compared to Growth
Tax History
| Year | Tax Paid | Tax Assessment Tax Assessment Total Assessment is a certain percentage of the fair market value that is determined by local assessors to be the total taxable value of land and additions on the property. | Land | Improvement |
|---|---|---|---|---|
| 2024 | $1,332 | $77,900 | $11,150 | $66,750 |
| 2022 | $1,035 | $48,150 | $9,275 | $38,875 |
| 2021 | $1,035 | $48,150 | $9,275 | $38,875 |
| 2020 | $1,035 | $48,150 | $9,275 | $38,875 |
| 2019 | $1,077 | $48,150 | $9,275 | $38,875 |
| 2018 | $1,077 | $45,250 | $6,500 | $38,750 |
| 2017 | $1,077 | $45,250 | $6,500 | $38,750 |
| 2016 | $1,077 | $45,250 | $6,500 | $38,750 |
| 2015 | $896 | $45,250 | $6,500 | $38,750 |
| 2014 | $896 | $45,250 | $6,500 | $38,750 |
Source: Public Records
Map
Nearby Homes
- 120 Wheelock Rd
- TBD Harmony Rd
- Lot 13 Larkins Farm Dr
- Lot 15 Steepleview Ct
- Lot 19 Steepleview Ct
- Lot 9 Larkins Farm Dr
- Lot 10 Larkins Farm Dr
- Lot 14 Steepleview Ct
- 110 Rhetts Way
- Tbd Tranquil Ct
- 00 Rd
- 665 Painter Rd
- 689 Painter Rd
- 140 Hulse Rd
- 0 A Deakins Rd
- 545 Fordtown Rd
- 480 Fordtown Rd
- 180 Kincheloe Rd
- 1238 Fordtown Rd
- 310 Mitchell Ct
- 181 Harmony Acres Dr E
- 200 Harmony Acres Dr W
- 182 Harmony Acres Dr E
- 179 Harmony Acres Dr E
- 192 Harmony Acres Dr W
- 199 Harmony Acres Dr E
- 176 Harmony Acres Dr W
- 209 Harmony Acres Dr E
- 210 Harmony Acres Dr W
- 156 Harmony Acres Dr W
- 169 Harmony Acres Dr E
- 154 Harmony Acres Dr W
- 170 Harmony Acres Dr E
- 201 Harmony Acres Dr W
- 195 Harmony Acres Dr W
- 187 Harmony Acres Dr W
- 217 Harmony Acres Dr E
- 196 Harmony Acres Dr E
- 150 Harmony Acres Dr W
- 177 Harmony Acres Dr W