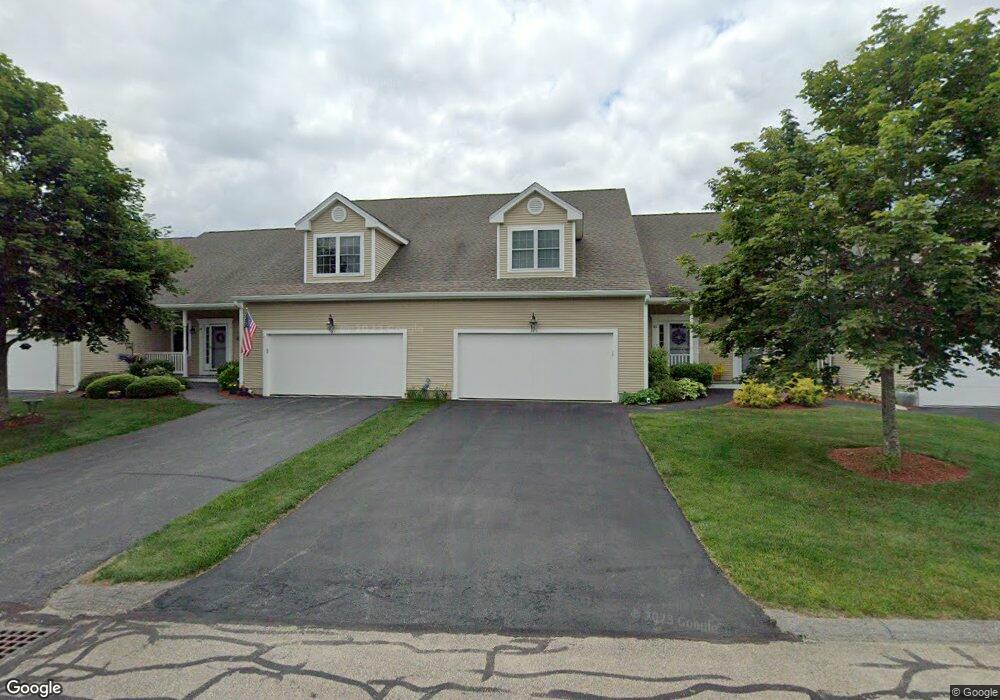
183 Horne Way Millbury, MA 01527
Estimated Value: $454,000 - $473,000
2
Beds
3
Baths
1,714
Sq Ft
$272/Sq Ft
Est. Value
About This Home
This home is located at 183 Horne Way, Millbury, MA 01527 and is currently estimated at $465,924, approximately $271 per square foot. 183 Horne Way is a home located in Worcester County with nearby schools including Elmwood Street Elementary School, Raymond E. Shaw Elementary School, and Millbury Junior/Senior High School.
Ownership History
Date
Name
Owned For
Owner Type
Purchase Details
Closed on
Mar 31, 2016
Sold by
Wilhelmsen John G and Wilhelmsen Kathleen J
Bought by
Moore Richard and Moore Alice L
Current Estimated Value
Purchase Details
Closed on
Aug 16, 2006
Sold by
Brierly Pond Realty Co
Bought by
Wilhelmsen John G and Wilhelmsen Kathleen J
Home Financials for this Owner
Home Financials are based on the most recent Mortgage that was taken out on this home.
Original Mortgage
$230,000
Interest Rate
6.88%
Mortgage Type
Purchase Money Mortgage
Create a Home Valuation Report for This Property
The Home Valuation Report is an in-depth analysis detailing your home's value as well as a comparison with similar homes in the area
Home Values in the Area
Average Home Value in this Area
Purchase History
| Date | Buyer | Sale Price | Title Company |
|---|---|---|---|
| Moore Richard | $322,500 | -- | |
| Wilhelmsen John G | $302,755 | -- |
Source: Public Records
Mortgage History
| Date | Status | Borrower | Loan Amount |
|---|---|---|---|
| Previous Owner | Wilhelmsen John G | $230,000 |
Source: Public Records
Tax History Compared to Growth
Tax History
| Year | Tax Paid | Tax Assessment Tax Assessment Total Assessment is a certain percentage of the fair market value that is determined by local assessors to be the total taxable value of land and additions on the property. | Land | Improvement |
|---|---|---|---|---|
| 2025 | $5,245 | $391,700 | $0 | $391,700 |
| 2024 | $5,504 | $416,000 | $0 | $416,000 |
| 2023 | $5,300 | $366,800 | $0 | $366,800 |
| 2022 | $4,835 | $322,300 | $0 | $322,300 |
| 2021 | $4,752 | $308,000 | $0 | $308,000 |
| 2020 | $4,458 | $290,800 | $0 | $290,800 |
| 2019 | $4,834 | $305,000 | $0 | $305,000 |
| 2018 | $4,984 | $305,000 | $0 | $305,000 |
| 2017 | $4,617 | $281,000 | $0 | $281,000 |
| 2016 | $4,439 | $269,700 | $0 | $269,700 |
| 2015 | $4,439 | $269,700 | $0 | $269,700 |
| 2014 | $4,213 | $246,400 | $0 | $246,400 |
Source: Public Records
Map
Nearby Homes
- 192 Horne Way Unit 192
- 92 Horne Way
- 32 Horne Way
- 57 Horne Way Unit 57
- 28 Brierly Cir
- 11 Laurel Dr
- 0 Auburn Rd
- 38 W Main St
- 124 Worcester Providence Turnpike
- 29 Winwood Rd
- 168 Burbank Rd
- 40 River St
- 4 Jessica j Dr
- 5 Mogren Dr
- 2 Jessica j Dr
- 39 S Main St
- 37-39 Main St
- 126 Burbank Rd
- 16 Jackie Dr
- 18 Lincoln Ave