183 Jenkins Rd Sumner, MS 38957
Estimated Value: $288,239 - $292,000
4
Beds
--
Bath
4,038
Sq Ft
$72/Sq Ft
Est. Value
About This Home
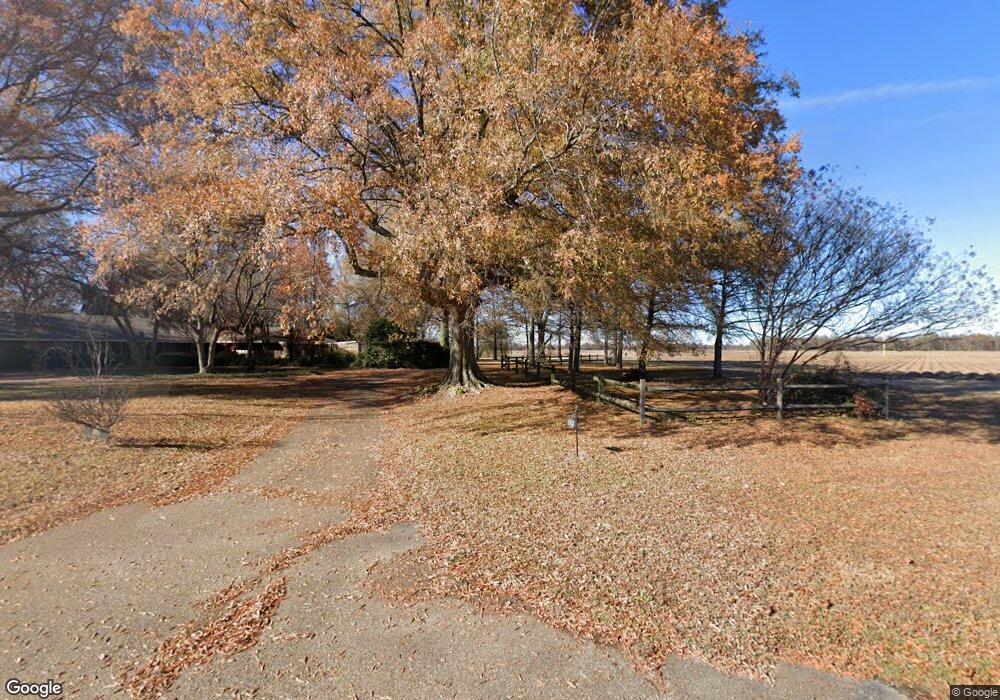
This home is located at 183 Jenkins Rd, Sumner, MS 38957 and is currently estimated at $290,120, approximately $71 per square foot. 183 Jenkins Rd is a home located in Tallahatchie County with nearby schools including R.H. Bearden Elementary School and West Tallahatchie High School.
Ownership History
Date
Name
Owned For
Owner Type
Purchase Details
Closed on
Sep 20, 2007
Sold by
Thornton Alcorn and Thornton Marley Christian
Bought by
Burnham Van R and Burnham Jennifer L
Current Estimated Value
Create a Home Valuation Report for This Property
The Home Valuation Report is an in-depth analysis detailing your home's value as well as a comparison with similar homes in the area
Purchase History
| Date | Buyer | Sale Price | Title Company |
|---|---|---|---|
| Burnham Van R | -- | -- |
Source: Public Records
Tax History
| Year | Tax Paid | Tax Assessment Tax Assessment Total Assessment is a certain percentage of the fair market value that is determined by local assessors to be the total taxable value of land and additions on the property. | Land | Improvement |
|---|---|---|---|---|
| 2025 | $1,578 | $20,489 | $1,000 | $19,489 |
| 2024 | $1,567 | $20,489 | $1,000 | $19,489 |
| 2023 | $1,480 | $20,489 | $1,000 | $19,489 |
| 2022 | $1,462 | $20,489 | $1,000 | $19,489 |
| 2021 | $1,432 | $20,489 | $1,000 | $19,489 |
| 2020 | $1,437 | $20,489 | $1,000 | $19,489 |
| 2019 | $1,460 | $20,489 | $1,000 | $19,489 |
| 2018 | $1,474 | $20,489 | $1,000 | $19,489 |
| 2017 | $1,947 | $20,489 | $1,000 | $19,489 |
| 2016 | $1,947 | $19,046 | $1,000 | $18,046 |
| 2015 | -- | $19,094 | $1,000 | $18,094 |
| 2014 | -- | $19,094 | $1,000 | $18,094 |
| 2013 | -- | $19,094 | $1,000 | $18,094 |
Source: Public Records
Map
Nearby Homes
- 118 N Cassidy St
- 10 Worley Road Dr
- 1032 Word
- 3491 Highway 32
- 10600 Hwy 3
- 0 Highway 32 Unit 4136050
- 2190 Old Highway 49
- + - 705 Acres Unit Tallahatchie County
- 1 Hampton Lake Rd
- 0 Bridges Ave Unit 11609195
- 0 Sturdivant-Rock Rd
- 0 Denton Rd
- 0 Sturdivant-White Rock Rd
- 11404 Tippo Rd
- 0 Bland Rd
- + - 312 Acres Unit Sunflower County MS
- County Road 549
- 201 Rogers Ave
- 205 Rogers Ave
- 0 Dry Bayou Rd
- 137 S Cassidy St
- 247 Jenkins Rd
- 299 Jenkins Rd
- 2149 Jenkins Rd
- 421 N Walnut St
- 504 Cassidy St
- 709 Walnut St
- 502 Cassidy St
- 2163 Jenkins Rd
- 2207 Jenkins Rd
- 321 Walnut St
- 430 Jennings St
- 2243 Jenkins Rd
- 422 Cassidy St
- 428 Jennings St
- 420 Cassidy St Unit 126
- 295 Walnut St
- 426 Jennings St
- 2313 Jenkins Rd
- 254 Jennings St
Your Personal Tour Guide
Ask me questions while you tour the home.