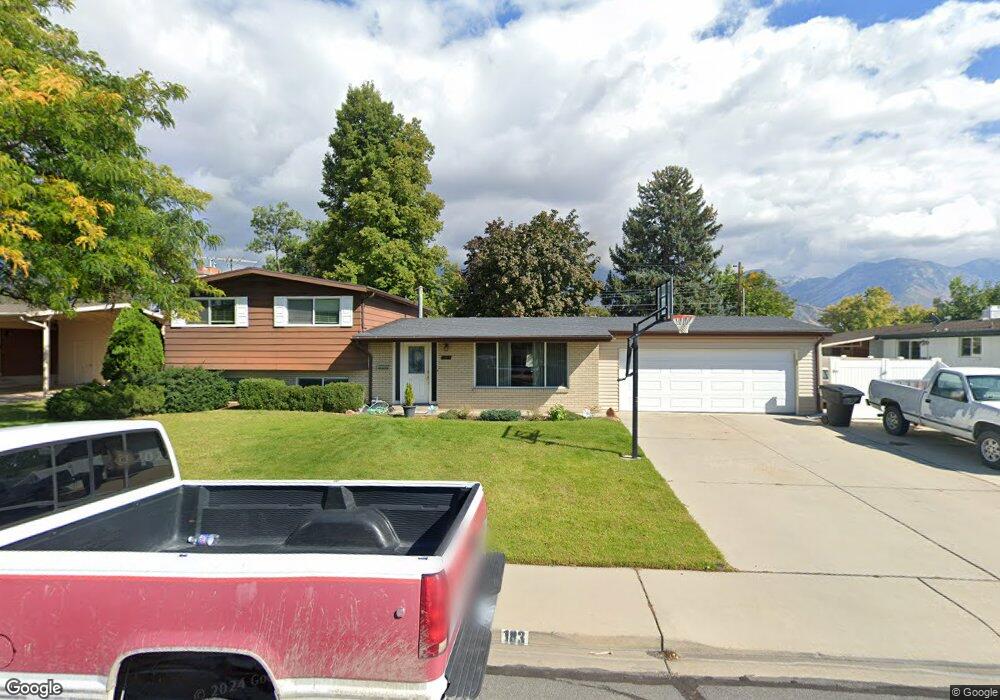
183 S 320 E Orem, UT 84058
SCERA NeighborhoodEstimated Value: $491,000 - $519,173
3
Beds
3
Baths
1,194
Sq Ft
$424/Sq Ft
Est. Value
About This Home
This home is located at 183 S 320 E, Orem, UT 84058 and is currently estimated at $506,724, approximately $424 per square foot. 183 S 320 E is a home located in Utah County with nearby schools including Centennial Elementary, Canyon View Junior High School, and Orem High School.
Ownership History
Date
Name
Owned For
Owner Type
Purchase Details
Closed on
Apr 11, 2012
Sold by
Flygare Russell L and Flygare Tina S
Bought by
Flygare Russell and Flygare Tina
Current Estimated Value
Home Financials for this Owner
Home Financials are based on the most recent Mortgage that was taken out on this home.
Original Mortgage
$183,600
Outstanding Balance
$126,515
Interest Rate
3.86%
Mortgage Type
New Conventional
Estimated Equity
$380,209
Purchase Details
Closed on
Apr 12, 2007
Sold by
Manning Keele Gerald Manning and Manning Gerald
Bought by
Flygare Russell L and Flygare Tina S
Home Financials for this Owner
Home Financials are based on the most recent Mortgage that was taken out on this home.
Original Mortgage
$190,400
Interest Rate
6.13%
Mortgage Type
New Conventional
Purchase Details
Closed on
Jan 26, 1999
Sold by
Keele Gerald Manning and Keele Joyce F
Bought by
Keele Gerald Manning and Keele Joyce F
Create a Home Valuation Report for This Property
The Home Valuation Report is an in-depth analysis detailing your home's value as well as a comparison with similar homes in the area
Home Values in the Area
Average Home Value in this Area
Purchase History
| Date | Buyer | Sale Price | Title Company |
|---|---|---|---|
| Flygare Russell | -- | Inwest Title Services Inc | |
| Flygare Russell L | -- | Affiliated First Title Comp | |
| Keele Gerald Manning | -- | -- |
Source: Public Records
Mortgage History
| Date | Status | Borrower | Loan Amount |
|---|---|---|---|
| Open | Flygare Russell | $183,600 | |
| Previous Owner | Flygare Russell L | $190,400 |
Source: Public Records
Tax History
| Year | Tax Paid | Tax Assessment Tax Assessment Total Assessment is a certain percentage of the fair market value that is determined by local assessors to be the total taxable value of land and additions on the property. | Land | Improvement |
|---|---|---|---|---|
| 2025 | $1,975 | $251,900 | -- | -- |
| 2024 | $1,975 | $241,505 | $0 | $0 |
| 2023 | $1,833 | $240,900 | $0 | $0 |
| 2022 | $1,777 | $226,215 | $0 | $0 |
| 2021 | $1,653 | $318,800 | $134,600 | $184,200 |
| 2020 | $1,521 | $288,300 | $107,700 | $180,600 |
| 2019 | $1,382 | $272,300 | $100,500 | $171,800 |
| 2018 | $1,330 | $250,400 | $96,900 | $153,500 |
| 2017 | $1,266 | $127,710 | $0 | $0 |
| 2016 | $1,216 | $113,080 | $0 | $0 |
| 2015 | $1,232 | $108,405 | $0 | $0 |
| 2014 | $1,215 | $106,425 | $0 | $0 |
Source: Public Records
Map
Nearby Homes
Your Personal Tour Guide
Ask me questions while you tour the home.