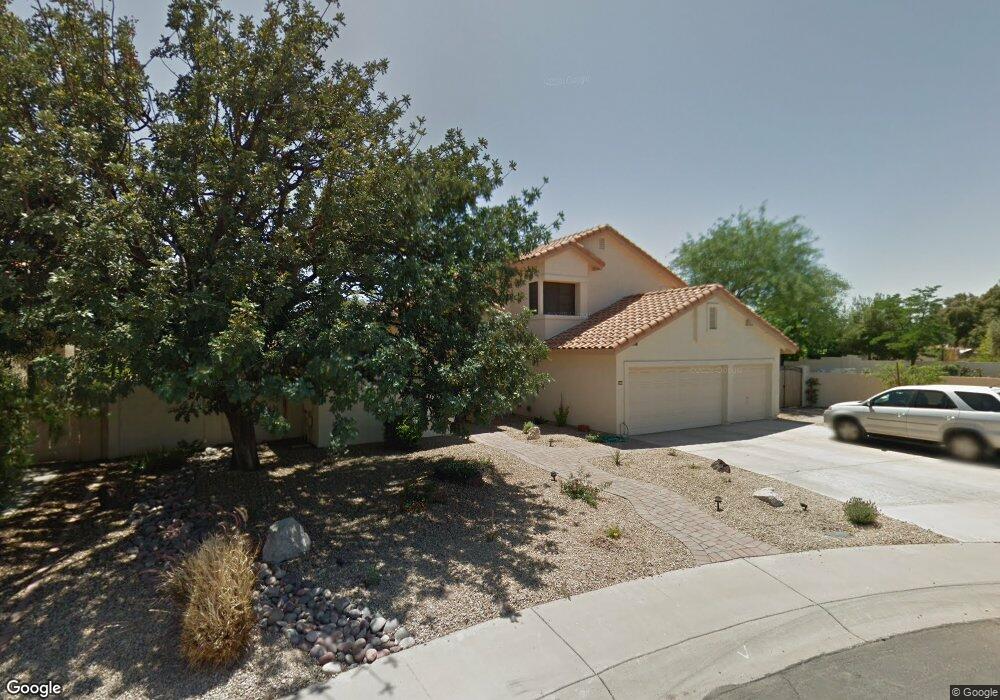
183 W Dawn Dr Tempe, AZ 85284
West Chandler NeighborhoodEstimated Value: $672,000 - $834,000
4
Beds
3
Baths
2,318
Sq Ft
$323/Sq Ft
Est. Value
About This Home
This home is located at 183 W Dawn Dr, Tempe, AZ 85284 and is currently estimated at $748,719, approximately $323 per square foot. 183 W Dawn Dr is a home located in Maricopa County with nearby schools including Kyrene de la Mariposa Elementary School, Kyrene del Pueblo Middle School, and Corona Del Sol High School.
Ownership History
Date
Name
Owned For
Owner Type
Purchase Details
Closed on
Nov 15, 2006
Sold by
Prudential Relocation Inc
Bought by
Liu Eric Jencheng and Leong Karen Gin
Current Estimated Value
Home Financials for this Owner
Home Financials are based on the most recent Mortgage that was taken out on this home.
Original Mortgage
$300,000
Outstanding Balance
$178,647
Interest Rate
6.33%
Mortgage Type
New Conventional
Estimated Equity
$570,072
Purchase Details
Closed on
Sep 2, 2006
Sold by
Murphy John R and Murphy Sarah A
Bought by
Prudential Relocation Inc
Purchase Details
Closed on
Apr 10, 2003
Sold by
Finberg Howard I and Finberg Kathlyn Oakley
Bought by
Murphy John R and Murphy Sarah A
Home Financials for this Owner
Home Financials are based on the most recent Mortgage that was taken out on this home.
Original Mortgage
$253,500
Interest Rate
3.62%
Mortgage Type
New Conventional
Create a Home Valuation Report for This Property
The Home Valuation Report is an in-depth analysis detailing your home's value as well as a comparison with similar homes in the area
Home Values in the Area
Average Home Value in this Area
Purchase History
| Date | Buyer | Sale Price | Title Company |
|---|---|---|---|
| Liu Eric Jencheng | $393,000 | Arizona Title Agency Inc | |
| Prudential Relocation Inc | -- | Arizona Title Agency Inc | |
| Murphy John R | $266,900 | Capital Title Agency Inc |
Source: Public Records
Mortgage History
| Date | Status | Borrower | Loan Amount |
|---|---|---|---|
| Open | Liu Eric Jencheng | $300,000 | |
| Previous Owner | Murphy John R | $253,500 |
Source: Public Records
Tax History Compared to Growth
Tax History
| Year | Tax Paid | Tax Assessment Tax Assessment Total Assessment is a certain percentage of the fair market value that is determined by local assessors to be the total taxable value of land and additions on the property. | Land | Improvement |
|---|---|---|---|---|
| 2025 | $4,582 | $47,523 | -- | -- |
| 2024 | $4,301 | $45,260 | -- | -- |
| 2023 | $4,301 | $54,380 | $10,870 | $43,510 |
| 2022 | $4,073 | $43,150 | $8,630 | $34,520 |
| 2021 | $4,178 | $41,020 | $8,200 | $32,820 |
| 2020 | $4,072 | $40,320 | $8,060 | $32,260 |
| 2019 | $3,933 | $37,000 | $7,400 | $29,600 |
| 2018 | $3,795 | $37,020 | $7,400 | $29,620 |
| 2017 | $3,627 | $35,620 | $7,120 | $28,500 |
| 2016 | $3,664 | $36,960 | $7,390 | $29,570 |
| 2015 | $3,384 | $33,650 | $6,730 | $26,920 |
Source: Public Records
Map
Nearby Homes
- 9011 S Dateland Dr
- 42 W La Vieve Ln
- 61 E Dawn Dr
- 311 W Jeanine Dr Unit 2
- 9276 S Myrtle Ave
- 91 W Calle de Arcos
- 8938 S Forest Ave
- 260 E Rhea Rd
- 8578 S Maple Ave
- 155 W Palomino Dr
- 8438 S Maple Ave
- 7026 E Warner Rd
- 8382 S Mill Ave
- 269 W El Freda Rd
- 12651 S 71st St
- 843 E Vera Ln
- 8336 S Homestead Ln
- 1001 E Caroline Ln
- 9132 S Parkside Dr
- 8272 S Pecan Grove Cir
- 175 W Dawn Dr
- 182 W Caroline Ln
- 174 W Caroline Ln
- 167 W Dawn Dr
- 184 W Dawn Dr
- 205 W La Vieve Ln
- 176 W Dawn Dr
- 166 W Caroline Ln
- 168 W Dawn Dr
- 161 W Dawn Dr
- 160 W Caroline Ln
- 185 W Caroline Ln
- 162 W Dawn Dr
- 177 W Caroline Ln
- 214 W Caroline Ln
- 185 W La Vieve Ln
- 177 W La Vieve Ln
- 204 W La Vieve Ln
- 169 W La Vieve Ln
- 217 W La Vieve Ln