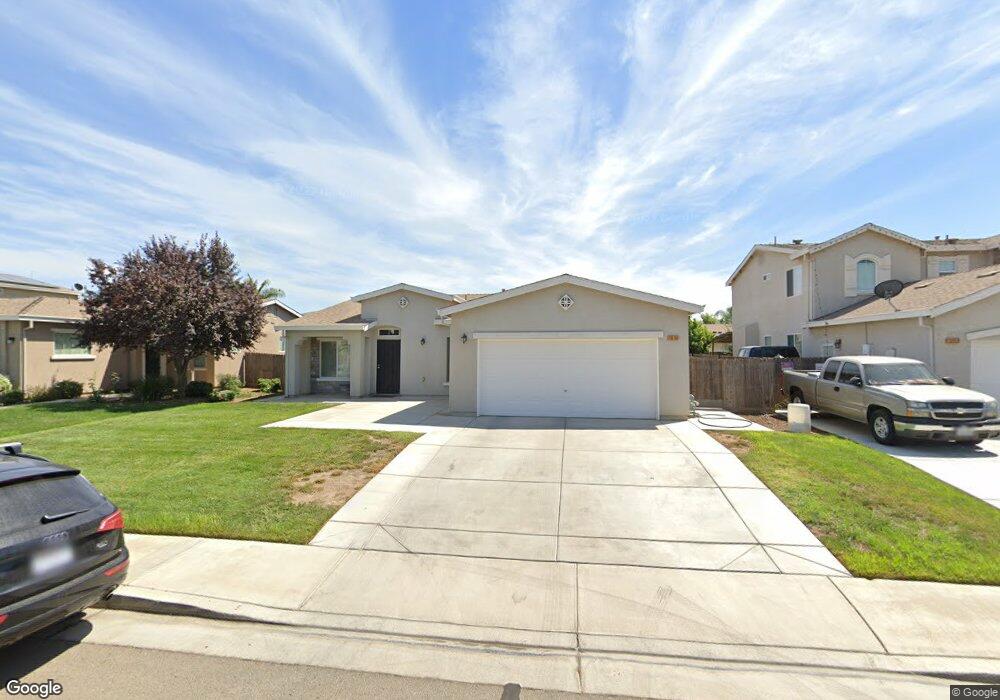
1830 Asa Gray Way Dinuba, CA 93618
Estimated Value: $373,595 - $441,000
4
Beds
2
Baths
1,863
Sq Ft
$220/Sq Ft
Est. Value
About This Home
This home is located at 1830 Asa Gray Way, Dinuba, CA 93618 and is currently estimated at $409,399, approximately $219 per square foot. 1830 Asa Gray Way is a home located in Tulare County with nearby schools including Jefferson Elementary School, Washington Intermediate School, and Dinuba High School.
Ownership History
Date
Name
Owned For
Owner Type
Purchase Details
Closed on
Jun 20, 2016
Sold by
Conklin Tim and Conklin Linda
Bought by
Kozuki Family Trust
Current Estimated Value
Purchase Details
Closed on
Jan 28, 2016
Sold by
Molina Hortencia Mendez and Gonzalez Gustavo G
Bought by
Conklin Tim and Conklin Linda
Purchase Details
Closed on
Apr 21, 2014
Sold by
Gonzalez Gustavo G and Molina Hortencia Mendoza
Bought by
Gonzalez Gustavo G
Purchase Details
Closed on
Jun 25, 2011
Sold by
K Hovnanian At Muirfield Llc
Bought by
Molina Hortencia Mendez and Gonzalez Gustavo G
Home Financials for this Owner
Home Financials are based on the most recent Mortgage that was taken out on this home.
Original Mortgage
$152,215
Interest Rate
5.5%
Mortgage Type
FHA
Create a Home Valuation Report for This Property
The Home Valuation Report is an in-depth analysis detailing your home's value as well as a comparison with similar homes in the area
Home Values in the Area
Average Home Value in this Area
Purchase History
| Date | Buyer | Sale Price | Title Company |
|---|---|---|---|
| Kozuki Family Trust | $203,000 | Chicago Title Company | |
| Conklin Tim | $158,500 | None Available | |
| Gonzalez Gustavo G | -- | None Available | |
| Molina Hortencia Mendez | $159,000 | None Available |
Source: Public Records
Mortgage History
| Date | Status | Borrower | Loan Amount |
|---|---|---|---|
| Previous Owner | Molina Hortencia Mendez | $152,215 |
Source: Public Records
Tax History Compared to Growth
Tax History
| Year | Tax Paid | Tax Assessment Tax Assessment Total Assessment is a certain percentage of the fair market value that is determined by local assessors to be the total taxable value of land and additions on the property. | Land | Improvement |
|---|---|---|---|---|
| 2025 | $2,765 | $235,595 | $38,298 | $197,297 |
| 2024 | $2,765 | $230,977 | $37,548 | $193,429 |
| 2023 | $2,737 | $226,449 | $36,812 | $189,637 |
| 2022 | $2,619 | $222,010 | $36,091 | $185,919 |
| 2021 | $2,558 | $217,657 | $35,383 | $182,274 |
| 2020 | $2,601 | $215,425 | $35,020 | $180,405 |
| 2019 | $2,632 | $211,201 | $34,333 | $176,868 |
| 2018 | $2,553 | $207,060 | $33,660 | $173,400 |
| 2017 | $2,534 | $203,000 | $33,000 | $170,000 |
| 2016 | $2,260 | $184,198 | $31,767 | $152,431 |
| 2015 | -- | $181,431 | $31,290 | $150,141 |
| 2014 | $2,070 | $156,000 | $39,000 | $117,000 |
Source: Public Records
Map
Nearby Homes
- 1981 Dunbar Way
- 2029 Golden Way
- 215 S Gloria Ave
- 1166 E Park Way
- 2770 E El Monte Way
- 42220 Road 92
- 65745 Big Meadows Rd
- 223 N H St
- 581 N Crawford Ave Unit 136
- 581 N Crawford Ave Unit 46
- 581 N Crawford Ave Unit 112
- 581 N Crawford Ave Unit 94
- 315 S P St
- 225 W Tulare St
- 0 N Hayes Ave
- 333 N L St
- 800 N Whitney Ave
- 0 S Alta Ave
- Savannah Plan at Empire Ranch
- Charlotte Plan at Empire Ranch
- 1806 Asa Gray Way
- 1854 Asa Gray Way
- 1829 Brown Way
- 1781 Brown Way
- 1805 Brown Way
- 1853 Brown Way
- 1878 Asa Gray Way
- 1782 Asa Gray Way
- 1877 Brown Way
- 1827 Asa Gray Way
- 1803 Asa Gray Way
- 1851 Asa Gray Way
- 1902 Asa Gray Way
- 1758 Asa Gray Way
- 1757 Brown Way
- 1875 Asa Gray Way
- 1779 Asa Gray Way
- 1901 Brown Way
- 1926 Asa Gray Way
- 1828 Brown Way