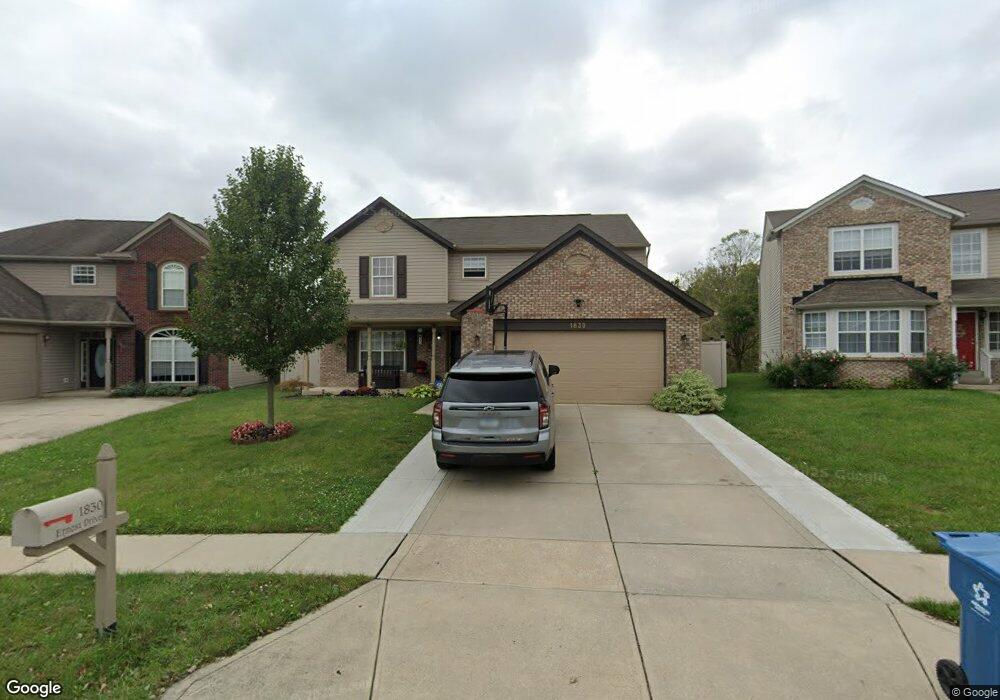
1830 Ernest Dr Indianapolis, IN 46234
Chapel Hill-Ben Davis NeighborhoodEstimated Value: $294,000 - $308,000
4
Beds
3
Baths
2,252
Sq Ft
$133/Sq Ft
Est. Value
About This Home
This home is located at 1830 Ernest Dr, Indianapolis, IN 46234 and is currently estimated at $300,598, approximately $133 per square foot. 1830 Ernest Dr is a home located in Marion County with nearby schools including Robey Elementary School, Chapel Hill 7th & 8th Grade Center, and Ben Davis High School.
Ownership History
Date
Name
Owned For
Owner Type
Purchase Details
Closed on
May 3, 2023
Sold by
Reynoso Salvador
Bought by
Sanchez Jose Salvador Rey and Villa Maria Araceli
Current Estimated Value
Purchase Details
Closed on
Nov 30, 2007
Sold by
Jackson Alphonso and Secretary Of Hud
Bought by
Reynoso Salvador
Home Financials for this Owner
Home Financials are based on the most recent Mortgage that was taken out on this home.
Original Mortgage
$120,550
Interest Rate
6.87%
Mortgage Type
Adjustable Rate Mortgage/ARM
Purchase Details
Closed on
Aug 31, 2007
Sold by
Midfirst Bank
Bought by
Secretary Of Hud
Purchase Details
Closed on
Jun 30, 2005
Sold by
Dura Builders Inc
Bought by
Such Thomas P
Home Financials for this Owner
Home Financials are based on the most recent Mortgage that was taken out on this home.
Original Mortgage
$143,893
Interest Rate
5.71%
Mortgage Type
FHA
Create a Home Valuation Report for This Property
The Home Valuation Report is an in-depth analysis detailing your home's value as well as a comparison with similar homes in the area
Home Values in the Area
Average Home Value in this Area
Purchase History
| Date | Buyer | Sale Price | Title Company |
|---|---|---|---|
| Sanchez Jose Salvador Rey | -- | None Listed On Document | |
| Reynoso Salvador | -- | Village Title Inc | |
| Secretary Of Hud | -- | None Available | |
| Midfirst Bank | $162,569 | None Available | |
| Such Thomas P | -- | None Available |
Source: Public Records
Mortgage History
| Date | Status | Borrower | Loan Amount |
|---|---|---|---|
| Previous Owner | Reynoso Salvador | $120,550 | |
| Previous Owner | Such Thomas P | $143,893 |
Source: Public Records
Tax History Compared to Growth
Tax History
| Year | Tax Paid | Tax Assessment Tax Assessment Total Assessment is a certain percentage of the fair market value that is determined by local assessors to be the total taxable value of land and additions on the property. | Land | Improvement |
|---|---|---|---|---|
| 2024 | $3,099 | $254,400 | $23,400 | $231,000 |
| 2023 | $3,099 | $257,200 | $23,400 | $233,800 |
| 2022 | $2,402 | $195,800 | $23,400 | $172,400 |
| 2021 | $2,534 | $183,900 | $23,400 | $160,500 |
| 2020 | $2,560 | $185,800 | $23,400 | $162,400 |
| 2019 | $2,503 | $182,000 | $23,400 | $158,600 |
| 2018 | $1,939 | $160,700 | $23,400 | $137,300 |
| 2017 | $1,820 | $151,200 | $23,400 | $127,800 |
| 2016 | $1,729 | $143,900 | $23,400 | $120,500 |
| 2014 | $1,241 | $124,100 | $23,400 | $100,700 |
| 2013 | $1,241 | $124,100 | $23,400 | $100,700 |
Source: Public Records
Map
Nearby Homes
- 2165 Crossford Way
- 2205 Whitecliff Dr
- 9218 Wind River Ct Unit 4155
- 1469 Turncoat Cir
- 1270 Valley Forge Dr
- 2325 Canvasback Dr
- 8610 Turnstone Ct
- 10762 Caval Cade Ct
- 8615 Longspur Ct
- 10762 Galant Fox Ct
- 8434 Country Meadows Dr
- 9230 W 10th St
- 2283 Seattle Slew Dr
- 1334 Legacy Ct
- 2350 Seattle Slew Dr
- 2502 Gadwall Cir
- 1357 Country Ridge Ln
- 1255 Country Ridge Ln
- 10436 Waverly Dr
- 8840 Ellington Dr