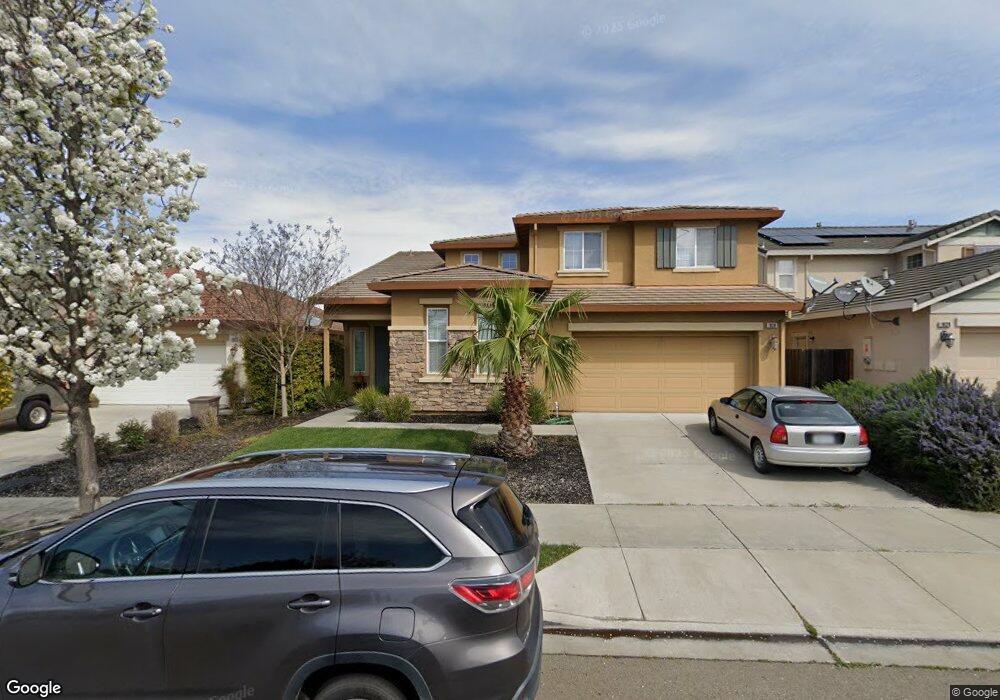
1830 Lakewood Dr Oakley, CA 94561
East Contra Costa NeighborhoodEstimated Value: $726,282 - $825,000
5
Beds
3
Baths
2,942
Sq Ft
$264/Sq Ft
Est. Value
About This Home
This home is located at 1830 Lakewood Dr, Oakley, CA 94561 and is currently estimated at $777,821, approximately $264 per square foot. 1830 Lakewood Dr is a home located in Contra Costa County with nearby schools including Summer Lake Elementary School, Delta Vista Middle School, and Freedom High School.
Ownership History
Date
Name
Owned For
Owner Type
Purchase Details
Closed on
May 16, 2018
Sold by
Robles Claudia C and Robles Jose D
Bought by
Robles Claudia C and Robles Jose D
Current Estimated Value
Home Financials for this Owner
Home Financials are based on the most recent Mortgage that was taken out on this home.
Original Mortgage
$463,000
Outstanding Balance
$398,658
Interest Rate
4.4%
Mortgage Type
New Conventional
Estimated Equity
$379,163
Purchase Details
Closed on
Oct 26, 2006
Sold by
Shea Homes Lp
Bought by
Robles Jose D and Robles Claudia C
Home Financials for this Owner
Home Financials are based on the most recent Mortgage that was taken out on this home.
Original Mortgage
$478,650
Interest Rate
3.99%
Mortgage Type
New Conventional
Purchase Details
Closed on
Dec 11, 2005
Sold by
Shea Homes Lp
Bought by
Shea Homes Lp
Create a Home Valuation Report for This Property
The Home Valuation Report is an in-depth analysis detailing your home's value as well as a comparison with similar homes in the area
Home Values in the Area
Average Home Value in this Area
Purchase History
| Date | Buyer | Sale Price | Title Company |
|---|---|---|---|
| Robles Claudia C | -- | Old Republic Title Company | |
| Robles Jose D | $598,500 | First American Title Co | |
| Shea Homes Lp | -- | First American Title Guarant |
Source: Public Records
Mortgage History
| Date | Status | Borrower | Loan Amount |
|---|---|---|---|
| Open | Robles Claudia C | $463,000 | |
| Closed | Robles Jose D | $478,650 |
Source: Public Records
Tax History Compared to Growth
Tax History
| Year | Tax Paid | Tax Assessment Tax Assessment Total Assessment is a certain percentage of the fair market value that is determined by local assessors to be the total taxable value of land and additions on the property. | Land | Improvement |
|---|---|---|---|---|
| 2025 | $12,533 | $726,000 | $248,753 | $477,247 |
| 2024 | $12,240 | $726,000 | $248,753 | $477,247 |
| 2023 | $12,240 | $708,000 | $242,586 | $465,414 |
| 2022 | $12,117 | $708,000 | $242,586 | $465,414 |
| 2021 | $10,457 | $573,500 | $196,502 | $376,998 |
| 2019 | $9,960 | $552,000 | $189,135 | $362,865 |
| 2018 | $9,242 | $508,000 | $174,060 | $333,940 |
| 2017 | $8,698 | $470,000 | $161,040 | $308,960 |
| 2016 | $7,877 | $428,500 | $146,820 | $281,680 |
| 2015 | $7,728 | $415,000 | $142,195 | $272,805 |
| 2014 | $7,027 | $359,500 | $123,178 | $236,322 |
Source: Public Records
Map
Nearby Homes
- 1256 Poplar Dr
- 1124 Lake Park Dr
- 1273 Poplar Dr
- 1642 Sycamore Dr
- 109 Clear Lake Ct
- 1410 Big Redwood Dr
- 124 Clear Lake Ct
- 133 Clear Lake Ct
- 917 Talaria Ct
- Residence 11 Plan at Rancher's Gate
- Residence 13 Plan at Rancher's Gate
- Residence 12 Plan at Rancher's Gate
- 736 Temescal St
- 764 Temescal St
- 732 Temescal St
- 400 Sonnet Ct
- 743 Temescal St
- Residence 2 Plan at Cattle Ridge
- Residence 3 Plan at Cattle Ridge
- Residence 1 Plan at Cattle Ridge
- 1836 Lakewood Dr
- 1824 Lakewood Dr
- 1818 Lakewood Dr
- 1199 Lake Park Dr
- 1812 Lakewood Dr
- 1191 Lake Park Dr
- 1806 Lakewood Dr
- 1800 Lakewood Dr
- 1183 Lake Park Dr
- 1180 Lake Park Dr
- 1175 Lake Park Dr
- 1248 Poplar Dr
- 1244 Poplar Dr
- 1252 Poplar Dr
- 20 Cactus Ln
- 1172 Lake Park Dr
- 1240 Poplar Dr
- 1167 Lake Park Dr
- 1236 Poplar Dr
- 1057 Clear Lake Dr