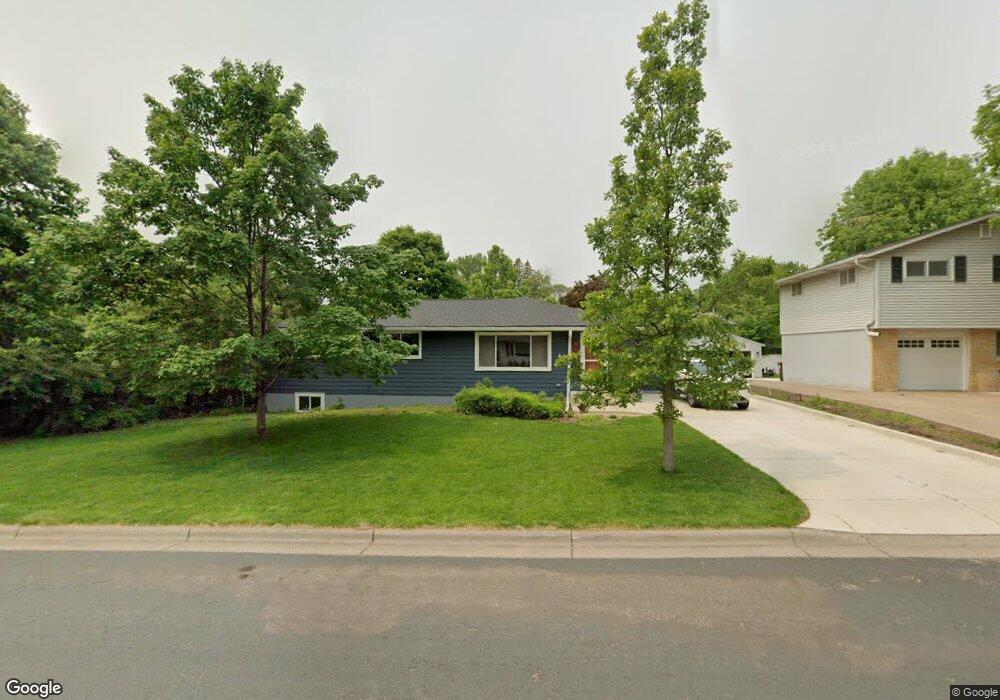
1830 Maple St Hastings, MN 55033
Hastings-Marshan Township NeighborhoodEstimated Value: $383,000 - $450,000
5
Beds
2
Baths
3,131
Sq Ft
$131/Sq Ft
Est. Value
About This Home
This home is located at 1830 Maple St, Hastings, MN 55033 and is currently estimated at $408,597, approximately $130 per square foot. 1830 Maple St is a home located in Dakota County with nearby schools including Pinecrest Elementary School, Hastings Middle School, and Hastings High School.
Ownership History
Date
Name
Owned For
Owner Type
Purchase Details
Closed on
Sep 5, 2014
Sold by
Botnen Joshua Joshua
Bought by
Newton Adam Adam
Current Estimated Value
Home Financials for this Owner
Home Financials are based on the most recent Mortgage that was taken out on this home.
Original Mortgage
$247,950
Outstanding Balance
$189,541
Interest Rate
4.1%
Estimated Equity
$219,056
Purchase Details
Closed on
Jul 30, 2013
Sold by
Botnen John and Botnen Barbara
Bought by
Botnen Joshua J and Botnen Kari L
Home Financials for this Owner
Home Financials are based on the most recent Mortgage that was taken out on this home.
Original Mortgage
$170,937
Interest Rate
3.62%
Mortgage Type
FHA
Purchase Details
Closed on
Aug 26, 2009
Sold by
Us Bank
Bought by
Botnen Joshua and Botnen John
Purchase Details
Closed on
Jul 16, 2004
Sold by
May Vallard and May Deborah
Bought by
Bignell Keith N and Bignell Laura C
Create a Home Valuation Report for This Property
The Home Valuation Report is an in-depth analysis detailing your home's value as well as a comparison with similar homes in the area
Home Values in the Area
Average Home Value in this Area
Purchase History
| Date | Buyer | Sale Price | Title Company |
|---|---|---|---|
| Newton Adam Adam | $261,000 | -- | |
| Botnen Joshua J | -- | Ancona Title & Escrow | |
| Botnen Joshua | $118,800 | -- | |
| Bignell Keith N | $216,842 | -- |
Source: Public Records
Mortgage History
| Date | Status | Borrower | Loan Amount |
|---|---|---|---|
| Open | Newton Adam Adam | $247,950 | |
| Previous Owner | Botnen Joshua J | $170,937 |
Source: Public Records
Tax History Compared to Growth
Tax History
| Year | Tax Paid | Tax Assessment Tax Assessment Total Assessment is a certain percentage of the fair market value that is determined by local assessors to be the total taxable value of land and additions on the property. | Land | Improvement |
|---|---|---|---|---|
| 2024 | $4,788 | $400,700 | $70,600 | $330,100 |
| 2023 | $4,788 | $414,600 | $70,700 | $343,900 |
| 2022 | $3,908 | $393,200 | $70,600 | $322,600 |
| 2021 | $3,812 | $324,000 | $61,400 | $262,600 |
| 2020 | $3,630 | $314,600 | $58,400 | $256,200 |
| 2019 | $3,469 | $291,800 | $55,800 | $236,000 |
| 2018 | $3,256 | $267,100 | $53,200 | $213,900 |
| 2017 | $3,082 | $244,800 | $50,700 | $194,100 |
| 2016 | $3,060 | $232,400 | $47,300 | $185,100 |
| 2015 | $2,886 | $208,773 | $42,458 | $166,315 |
| 2014 | -- | $197,764 | $40,635 | $157,129 |
| 2013 | -- | $172,367 | $35,854 | $136,513 |
Source: Public Records
Map
Nearby Homes
- 1906 Oak St
- 1600 Spring St
- 708 15th St W
- 403 13th St W
- 1016 15th St W
- 131 24th St W
- 2970 Highview Knolls
- 528 17th St E
- 664 35th St W
- 1307 20th St W
- 816 Eddy St
- 1221 14th St W
- 1227 14th St W
- 2168 Westpointe Dr
- 930 Lyn Way Unit 204
- 753 Greten Ln
- 456 Hayes Dr Unit 59
- 3525 Vermillion St
- 515 5th St W
- 3575 Vermillion St