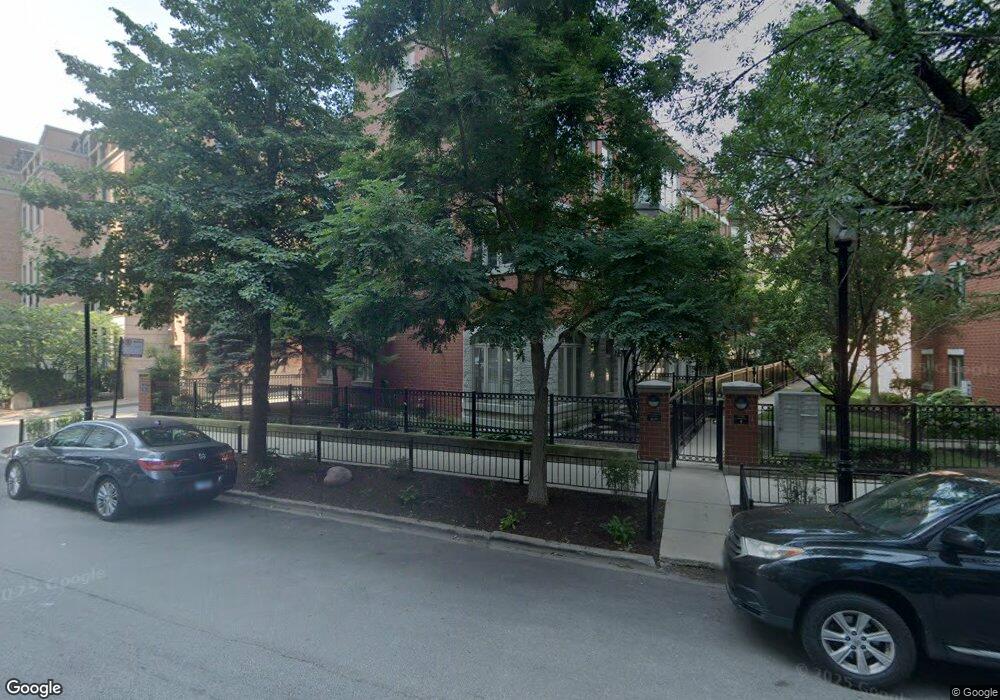
1830 S Calumet Ave Unit 7 Chicago, IL 60616
Prairie District NeighborhoodEstimated Value: $914,272 - $1,305,000
3
Beds
3
Baths
3,000
Sq Ft
$345/Sq Ft
Est. Value
About This Home
This home is located at 1830 S Calumet Ave Unit 7, Chicago, IL 60616 and is currently estimated at $1,034,318, approximately $344 per square foot. 1830 S Calumet Ave Unit 7 is a home located in Cook County with nearby schools including National Teachers Academy, Wendell Phillips Academy High School, and Perspectives Chtr - Joslin Campus.
Ownership History
Date
Name
Owned For
Owner Type
Purchase Details
Closed on
Aug 29, 2019
Sold by
Byerwalter Anne M and Chew Richard
Bought by
Williams Alton
Current Estimated Value
Purchase Details
Closed on
Jun 1, 2006
Sold by
Karsh Lawrence
Bought by
Byerwalter Anne M
Home Financials for this Owner
Home Financials are based on the most recent Mortgage that was taken out on this home.
Original Mortgage
$660,000
Interest Rate
6.52%
Mortgage Type
Unknown
Purchase Details
Closed on
Nov 4, 2002
Sold by
Prairie District Homes Llc
Bought by
The Karsh Family Trust
Home Financials for this Owner
Home Financials are based on the most recent Mortgage that was taken out on this home.
Original Mortgage
$494,884
Interest Rate
5.5%
Create a Home Valuation Report for This Property
The Home Valuation Report is an in-depth analysis detailing your home's value as well as a comparison with similar homes in the area
Home Values in the Area
Average Home Value in this Area
Purchase History
| Date | Buyer | Sale Price | Title Company |
|---|---|---|---|
| Williams Alton | $870,000 | Attorney | |
| Byerwalter Anne M | $825,000 | Stewart Title Of Illinois | |
| The Karsh Family Trust | $619,000 | Stewart Title |
Source: Public Records
Mortgage History
| Date | Status | Borrower | Loan Amount |
|---|---|---|---|
| Previous Owner | Byerwalter Anne M | $660,000 | |
| Previous Owner | The Karsh Family Trust | $494,884 |
Source: Public Records
Tax History Compared to Growth
Tax History
| Year | Tax Paid | Tax Assessment Tax Assessment Total Assessment is a certain percentage of the fair market value that is determined by local assessors to be the total taxable value of land and additions on the property. | Land | Improvement |
|---|---|---|---|---|
| 2024 | $15,453 | $77,000 | $29,667 | $47,333 |
| 2023 | $15,062 | $73,000 | $23,870 | $49,130 |
| 2022 | $15,062 | $73,000 | $23,870 | $49,130 |
| 2021 | $14,723 | $73,000 | $23,870 | $49,130 |
| 2020 | $12,893 | $57,876 | $19,607 | $38,269 |
| 2019 | $11,950 | $62,909 | $19,607 | $43,302 |
| 2018 | $11,748 | $62,909 | $19,607 | $43,302 |
| 2017 | $13,884 | $67,870 | $16,197 | $51,673 |
| 2016 | $13,093 | $67,870 | $16,197 | $51,673 |
| 2015 | $11,956 | $67,870 | $16,197 | $51,673 |
| 2014 | $9,616 | $54,398 | $14,492 | $39,906 |
| 2013 | $9,415 | $54,398 | $14,492 | $39,906 |
Source: Public Records
Map
Nearby Homes
- 1919 S Prairie Ave Unit 3
- 1841 S Calumet Ave Unit 1602
- 1841 S Calumet Ave Unit 2102
- 1841 S Calumet Ave Unit P197
- 1841 S Calumet Ave Unit GU211
- 1901 S Calumet Ave Unit 2912
- 1901 S Calumet Ave Unit 1405
- 1901 S Calumet Ave Unit 1803
- 1901 S Calumet Ave Unit 2301
- 1901 S Calumet Ave Unit 2712
- 1733 S Prairie Ave
- 1717 S Prairie Ave Unit 1910
- 1717 S Prairie Ave Unit 705
- 324 E 17th St Unit 324
- 212 E Cullerton St Unit 702
- 212 E Cullerton St Unit PH-09
- 212 E Cullerton St Unit 1109
- 212 E Cullerton St Unit 606
- 212 E Cullerton St Unit 504
- 212 E Cullerton St Unit 1209
- 1830 S Calumet Pkwy Unit 6F
- 1830 S Calumet Pkwy
- 1830 S Calumet Pkwy Unit A
- 1830 S Calumet Pkwy Unit 3
- 1830 S Calumet Pkwy Unit 3C
- 1830 S Calumet Pkwy Unit 4D
- 1830 S Calumet Ave Unit 4D
- 1830 S Calumet Ave Unit 5E
- 1830 S Calumet Ave Unit 5
- 1830 S Calumet Ave Unit 7G
- 1830 S Calumet Ave
- 1830 S Calumet Ave
- 1830 S Calumet Ave
- 1830 S Calumet Ave
- 1830 S Calumet Ave Unit A
- 1830 S Calumet Ave Unit 3C
- 1830 S Calumet Ave Unit 6F
- 1836 S Calumet Ave
- 1818 S Calumet Ave
- 1834 S Calumet Ave Unit 1