1830 S Springfield Ave Unit 183 Chicago, IL 60623
North Lawndale NeighborhoodEstimated Value: $42,000 - $149,955
3
Beds
2
Baths
1,348
Sq Ft
$82/Sq Ft
Est. Value
About This Home
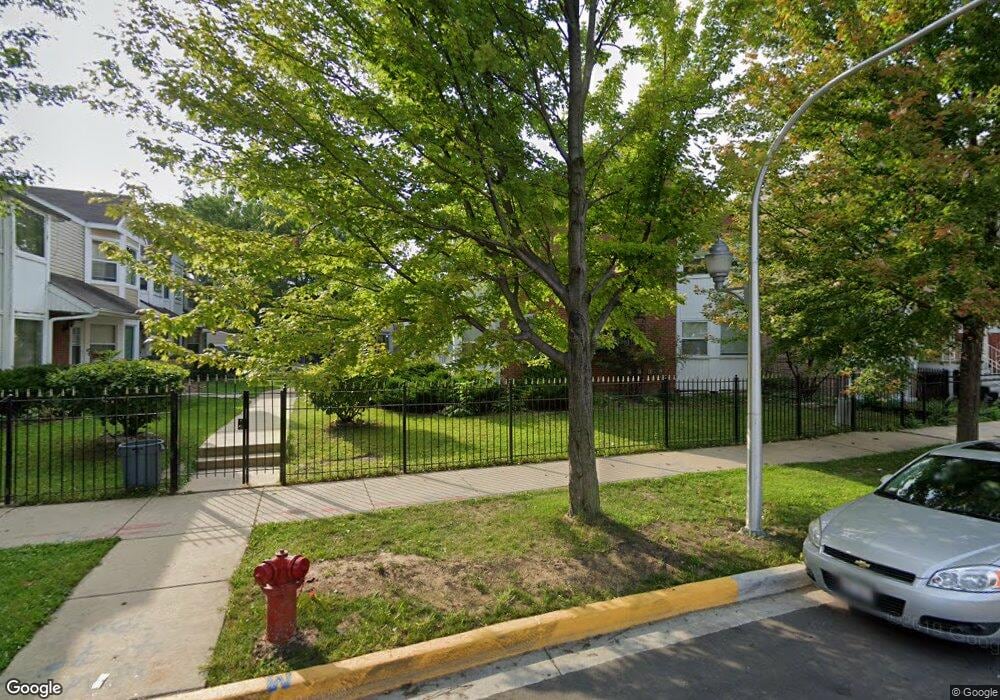
This home is located at 1830 S Springfield Ave Unit 183, Chicago, IL 60623 and is currently estimated at $110,739, approximately $82 per square foot. 1830 S Springfield Ave Unit 183 is a home located in Cook County with nearby schools including Mason Elementary School and KIPP Chicago Chrtrs - Ascend Acad.
Ownership History
Date
Name
Owned For
Owner Type
Purchase Details
Closed on
Oct 19, 2023
Sold by
Macias Nachieli
Bought by
Macias Nachieli and Ramirez Joaquin Velasco
Current Estimated Value
Purchase Details
Closed on
Sep 22, 2017
Sold by
Secretary Of Hud
Bought by
Macias Nachieli
Purchase Details
Closed on
Feb 28, 2017
Sold by
Lakeview Loan Servicing Llc
Bought by
The Secretary Of Hud
Purchase Details
Closed on
Feb 2, 2017
Sold by
Nichols Lillian D
Bought by
Lakeview Loan Servicing Llc
Purchase Details
Closed on
Jul 17, 1997
Sold by
Isaiah Community Development Group
Bought by
Robinson Lillian D
Home Financials for this Owner
Home Financials are based on the most recent Mortgage that was taken out on this home.
Original Mortgage
$57,400
Interest Rate
7.71%
Create a Home Valuation Report for This Property
The Home Valuation Report is an in-depth analysis detailing your home's value as well as a comparison with similar homes in the area
Home Values in the Area
Average Home Value in this Area
Purchase History
| Date | Buyer | Sale Price | Title Company |
|---|---|---|---|
| Macias Nachieli | -- | None Listed On Document | |
| Macias Nachieli | -- | Stewart Title | |
| The Secretary Of Hud | -- | Attorney | |
| Lakeview Loan Servicing Llc | -- | Attorney | |
| Robinson Lillian D | $72,500 | Chicago Title Insurance Co |
Source: Public Records
Mortgage History
| Date | Status | Borrower | Loan Amount |
|---|---|---|---|
| Previous Owner | Robinson Lillian D | $57,400 |
Source: Public Records
Tax History
| Year | Tax Paid | Tax Assessment Tax Assessment Total Assessment is a certain percentage of the fair market value that is determined by local assessors to be the total taxable value of land and additions on the property. | Land | Improvement |
|---|---|---|---|---|
| 2025 | $1,309 | $13,090 | $2,923 | $10,167 |
| 2024 | $1,309 | $13,090 | $2,923 | $10,167 |
| 2023 | $1,255 | $9,500 | $2,368 | $7,132 |
| 2022 | $1,255 | $9,500 | $2,368 | $7,132 |
| 2021 | $1,245 | $9,499 | $2,368 | $7,131 |
| 2020 | $1,314 | $8,981 | $2,368 | $6,613 |
| 2019 | $1,327 | $10,011 | $2,368 | $7,643 |
| 2018 | $1,303 | $10,011 | $2,368 | $7,643 |
| 2017 | $1,325 | $9,511 | $2,116 | $7,395 |
| 2016 | $1,405 | $9,511 | $2,116 | $7,395 |
| 2015 | $1,262 | $9,511 | $2,116 | $7,395 |
| 2014 | $711 | $6,400 | $2,116 | $4,284 |
| 2013 | $686 | $6,400 | $2,116 | $4,284 |
Source: Public Records
Map
Nearby Homes
- 1824 S Harding Ave
- 1912 S Harding Ave
- 1831 S Avers Ave
- 1647 S Harding Ave
- 1903 S Hamlin Ave
- 1855 S Komensky Ave
- 1825 S Komensky Ave
- 4014 W 21st St
- 1910 S Ridgeway Ave
- 2106 S Pulaski Rd
- 1932 S Ridgeway Ave
- 1650 S Ridgeway Ave
- 1615 S Komensky Ave
- 4104 W 16th St
- 4023 W 16th St
- 1642 S Karlov Ave
- 4022 W Cermak Rd
- 1803 S Lawndale Ave
- 3242 W Ogden Ave
- 4107 W 16th St
- 1838 S Springfield Ave Unit 183
- 1830 S Springfield Ave Unit 183
- 1830 S Springfield Ave Unit 183
- 1830 S Springfield Ave Unit 183
- 1830 S Springfield Ave Unit 183
- 1830 S Springfield Ave Unit 183
- 1838 S Springfield Ave Unit 183
- 1838 S Springfield Ave
- 1838 S Springfield Ave Unit B
- 1830 S Springfield Ave Unit B
- 1838 S Springfield Ave Unit C
- 1840 S Springfield Ave
- 1826 S Springfield Ave
- 1826 S Springfield Ave
- 1826 S Springfield Ave Unit 2
- 1824 S Springfield Ave
- 1842 S Springfield Ave
- 1820 S Springfield Ave
- 1846 S Springfield Ave
- 1848 S Springfield Ave
Your Personal Tour Guide
Ask me questions while you tour the home.