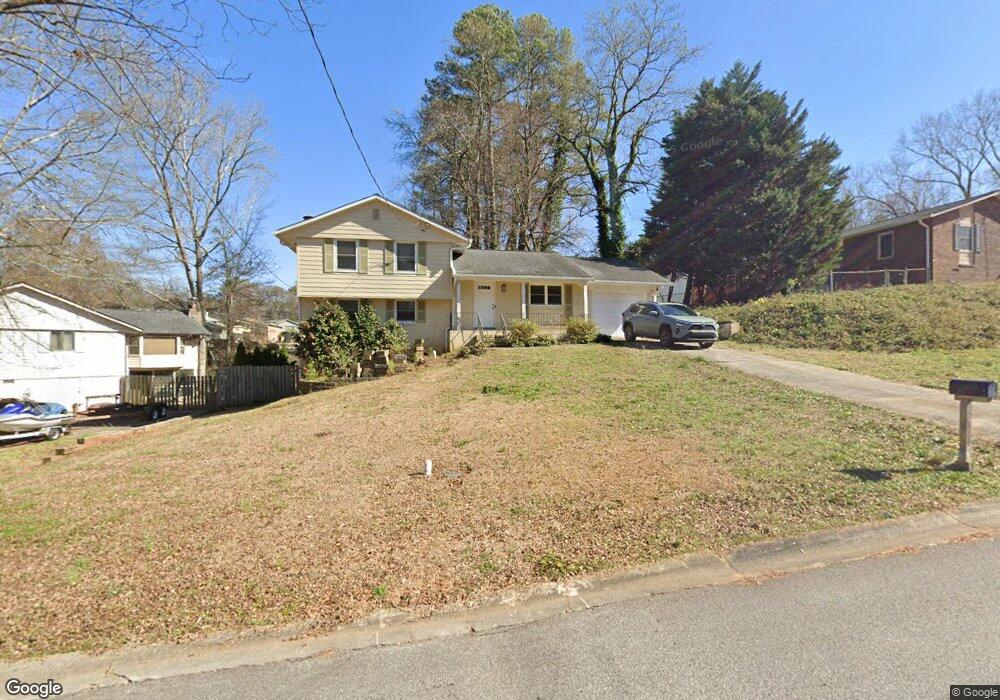
1830 Tecumseh Trail SE Unit 2 Smyrna, GA 30080
Estimated Value: $357,000 - $423,106
3
Beds
3
Baths
1,088
Sq Ft
$364/Sq Ft
Est. Value
About This Home
This home is located at 1830 Tecumseh Trail SE Unit 2, Smyrna, GA 30080 and is currently estimated at $396,527, approximately $364 per square foot. 1830 Tecumseh Trail SE Unit 2 is a home located in Cobb County with nearby schools including Teasley Elementary School, Campbell Middle School, and Campbell High School.
Ownership History
Date
Name
Owned For
Owner Type
Purchase Details
Closed on
Mar 29, 2004
Sold by
Barbanell Davin R and Barbanell Barbara
Bought by
Paz Jennifer
Current Estimated Value
Home Financials for this Owner
Home Financials are based on the most recent Mortgage that was taken out on this home.
Original Mortgage
$118,400
Outstanding Balance
$54,792
Interest Rate
5.53%
Mortgage Type
New Conventional
Estimated Equity
$341,735
Purchase Details
Closed on
Jan 25, 2002
Sold by
Bellofatto Stephen J and Bellofatto Kim
Bought by
Barbanell Barbara and Barbanell Davin R
Home Financials for this Owner
Home Financials are based on the most recent Mortgage that was taken out on this home.
Original Mortgage
$120,000
Interest Rate
5.25%
Mortgage Type
New Conventional
Purchase Details
Closed on
Mar 30, 1993
Sold by
Ward Kimberly A
Bought by
Bellofatto Stephen J and Bellofatto Kim
Home Financials for this Owner
Home Financials are based on the most recent Mortgage that was taken out on this home.
Original Mortgage
$89,900
Interest Rate
7.51%
Mortgage Type
VA
Create a Home Valuation Report for This Property
The Home Valuation Report is an in-depth analysis detailing your home's value as well as a comparison with similar homes in the area
Home Values in the Area
Average Home Value in this Area
Purchase History
| Date | Buyer | Sale Price | Title Company |
|---|---|---|---|
| Paz Jennifer | $148,000 | -- | |
| Barbanell Barbara | $150,000 | -- | |
| Bellofatto Stephen J | $89,900 | -- |
Source: Public Records
Mortgage History
| Date | Status | Borrower | Loan Amount |
|---|---|---|---|
| Open | Paz Jennifer | $118,400 | |
| Previous Owner | Barbanell Barbara | $120,000 | |
| Previous Owner | Bellofatto Stephen J | $89,900 |
Source: Public Records
Tax History Compared to Growth
Tax History
| Year | Tax Paid | Tax Assessment Tax Assessment Total Assessment is a certain percentage of the fair market value that is determined by local assessors to be the total taxable value of land and additions on the property. | Land | Improvement |
|---|---|---|---|---|
| 2025 | $3,270 | $163,540 | $40,000 | $123,540 |
| 2024 | $3,091 | $153,972 | $40,000 | $113,972 |
| 2023 | $2,446 | $145,628 | $30,000 | $115,628 |
| 2022 | $2,408 | $116,324 | $30,000 | $86,324 |
| 2021 | $2,272 | $108,348 | $30,000 | $78,348 |
| 2020 | $2,272 | $108,348 | $30,000 | $78,348 |
| 2019 | $1,869 | $87,168 | $30,000 | $57,168 |
| 2018 | $1,723 | $79,488 | $30,000 | $49,488 |
| 2017 | $1,646 | $79,676 | $24,000 | $55,676 |
| 2016 | $1,627 | $78,536 | $24,000 | $54,536 |
| 2015 | $1,229 | $56,420 | $24,000 | $32,420 |
| 2014 | $1,241 | $56,420 | $0 | $0 |
Source: Public Records
Map
Nearby Homes
- 3485 Navaho Trail SE
- 3505 Commanche Ct SE
- 3412 Archerfield Way
- 3365 Vintage Cir SE Unit 5
- 3365 Vintage Cir SE
- 1749 Creat Trail SE
- 3522 Ivy Manor Rd SE
- 2002 Ivy Ridge Rd SE
- 1736 Seneca Ct SE
- 3534 Clancy Way Unit 11
- 3351 Vintage Cir SE
- 0 Church St Unit 10397761
- 0 Church St Unit 7473410
- 7 Villa Ct SE
- Glover Plan at Archerfield
- Reynolds Plan at Archerfield
- 3415 Archerfield Way
- 3404 Archerfield Way
- 3408 Archerfield Way
- 3416 Archerfield Way
- 1820 Tecumseh Trail SE
- 1850 Tecumseh Trail SE
- 1860 Tecumseh Trail SE Unit 2
- 1839 Creat Trail SE
- 1831 Tecumseh Trail SE
- 1847 Creat Trail SE Unit 1
- 1841 Tecumseh Trail SE
- 1870 Tecumseh Trail SE
- 1811 Creat Trail SE
- 1849 Tecumseh Trail SE
- 1828 Creat Trail SE
- 1880 Tecumseh Trail SE
- 1836 Creat Trail SE
- 1857 Creat Trail SE
- 1855 Tecumseh Trail SE
- 3501 Commanche Ct SE Unit 2
- 1845 Creat Trail SE
- 1820 Creat Trail SE
- 1805 Creat Trail SE
- 3499 Navaho Trail SE