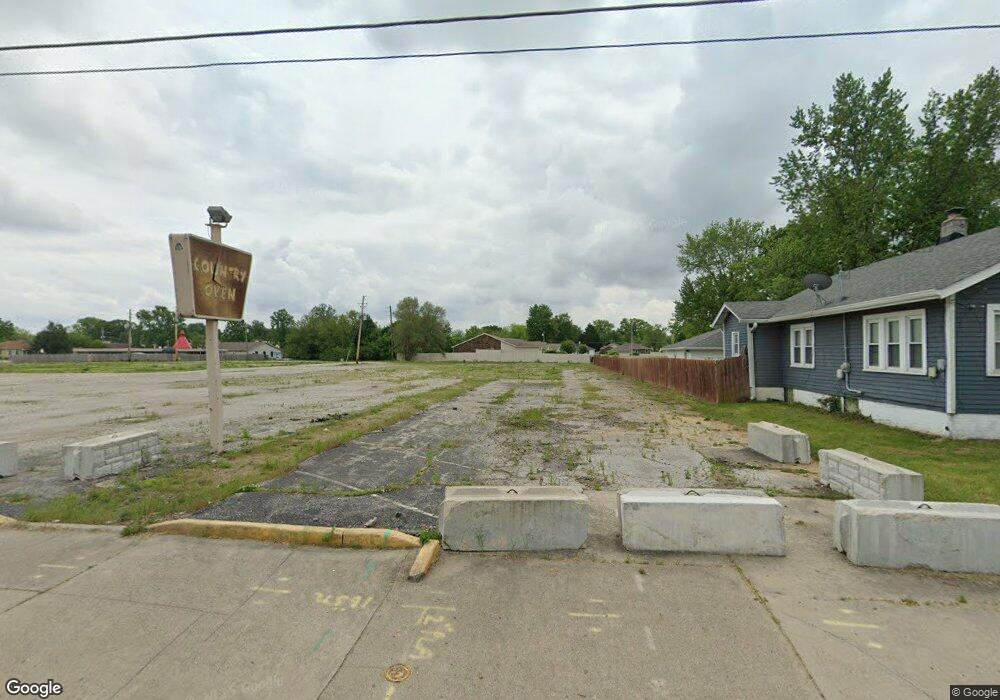
1831 Albany St Beech Grove, IN 46107
Estimated Value: $890,901
--
Bed
--
Bath
2,200
Sq Ft
$405/Sq Ft
Est. Value
About This Home
This home is located at 1831 Albany St, Beech Grove, IN 46107 and is currently estimated at $890,901, approximately $404 per square foot. 1831 Albany St is a home located in Marion County with nearby schools including Hornet Park Elementary School, Central Elementary School, and South Grove Intermediate School.
Ownership History
Date
Name
Owned For
Owner Type
Purchase Details
Closed on
Dec 16, 2024
Sold by
Spz Enterprises Limited Partnership
Bought by
Mechanical Skills Inc
Current Estimated Value
Purchase Details
Closed on
Mar 7, 2022
Sold by
Msi Beech Grove Grocery Owners Llc
Bought by
Spz Enterprises Limited Partnership
Purchase Details
Closed on
Aug 26, 2010
Sold by
Croasmun William J
Bought by
Msi Beech Grove Grocery Owners Llc
Purchase Details
Closed on
Apr 9, 2009
Sold by
Be Mar Corporation
Bought by
Not Provided William J
Create a Home Valuation Report for This Property
The Home Valuation Report is an in-depth analysis detailing your home's value as well as a comparison with similar homes in the area
Home Values in the Area
Average Home Value in this Area
Purchase History
| Date | Buyer | Sale Price | Title Company |
|---|---|---|---|
| Mechanical Skills Inc | -- | None Listed On Document | |
| Mechanical Skills Inc | $1,300,000 | None Listed On Document | |
| Spz Enterprises Limited Partnership | -- | None Listed On Document | |
| Msi Beech Grove Grocery Owners Llc | -- | Lenders Escrow & Title | |
| Not Provided William J | -- | None Available |
Source: Public Records
Tax History Compared to Growth
Tax History
| Year | Tax Paid | Tax Assessment Tax Assessment Total Assessment is a certain percentage of the fair market value that is determined by local assessors to be the total taxable value of land and additions on the property. | Land | Improvement |
|---|---|---|---|---|
| 2024 | $2,470 | $65,200 | $61,500 | $3,700 |
| 2023 | $2,470 | $65,200 | $61,500 | $3,700 |
| 2022 | $5,300 | $139,000 | $76,800 | $62,200 |
| 2021 | $4,892 | $267,900 | $174,600 | $93,300 |
| 2020 | $10,218 | $283,600 | $174,600 | $109,000 |
| 2019 | $9,790 | $279,100 | $174,600 | $104,500 |
| 2018 | $9,547 | $279,100 | $174,600 | $104,500 |
| 2017 | $9,575 | $273,400 | $174,600 | $98,800 |
| 2016 | $9,413 | $270,700 | $174,600 | $96,100 |
| 2014 | $9,457 | $282,300 | $174,600 | $107,700 |
| 2013 | $9,457 | $282,300 | $174,600 | $107,700 |
Source: Public Records
Map
Nearby Homes
- 2017 Ticen Ct
- 30 Gilbert Ave
- 2060 Alton St
- 2215 Albany St
- 1995 Britton Dr
- 1514 Main St
- 2180 Cleveland St
- 258 N 16th Ave
- 301 N 17th Ave
- 62 N 13th Ave
- 349 N 17th Ave
- 3608 E Sumner Ave
- 415 N 17th Ave
- 2832 S Oakland Ave
- 1617 Capra Ct
- 2021 Prospect St
- 1121 Alton St
- 76 S 11th Ave
- 1614 Capra Ct
- 1701 Southern Ave