1831 E El Monte Way Dinuba, CA 93618
Estimated Value: $349,000 - $3,108,321
--
Bed
--
Bath
--
Sq Ft
0.87
Acres
About This Home
This home is located at 1831 E El Monte Way, Dinuba, CA 93618 and is currently estimated at $1,387,440. 1831 E El Monte Way is a home located in Tulare County with nearby schools including Kennedy Elementary School, Washington Intermediate School, and Dinuba High School.
Ownership History
Date
Name
Owned For
Owner Type
Purchase Details
Closed on
Oct 10, 2024
Sold by
Dinuba One Llc
Bought by
Dwelle Family Limited Partnership
Current Estimated Value
Purchase Details
Closed on
Oct 9, 2024
Sold by
Dwelle Homes
Bought by
Dwelle Family Limited Partnership
Purchase Details
Closed on
Aug 28, 2024
Sold by
Dwelle Family Limited Partnership
Bought by
Dwelle Family Limited Partnership
Purchase Details
Closed on
May 3, 2024
Sold by
Dwelle Family Limited Partnership
Bought by
Dinuba One Llc
Purchase Details
Closed on
Feb 4, 2021
Sold by
Noroian George
Bought by
Dwelle Family Limited Partnership
Purchase Details
Closed on
Apr 10, 2007
Sold by
Lumsden James M
Bought by
Lumsden James M and Lumsden Fae A
Create a Home Valuation Report for This Property
The Home Valuation Report is an in-depth analysis detailing your home's value as well as a comparison with similar homes in the area
Home Values in the Area
Average Home Value in this Area
Purchase History
| Date | Buyer | Sale Price | Title Company |
|---|---|---|---|
| Dwelle Family Limited Partnership | -- | Chicago Title | |
| Dwelle Family Limited Partnership | -- | Chicago Title | |
| Dwelle Family Limited Partnership | -- | Chicago Title | |
| Dinuba One Llc | $949,000 | Chicago Title | |
| Dwelle Family Limited Partnership | -- | Chicago Title | |
| Dwelle Family Limited Partnership | $400,000 | None Available | |
| Lumsden James M | -- | None Available |
Source: Public Records
Tax History Compared to Growth
Tax History
| Year | Tax Paid | Tax Assessment Tax Assessment Total Assessment is a certain percentage of the fair market value that is determined by local assessors to be the total taxable value of land and additions on the property. | Land | Improvement |
|---|---|---|---|---|
| 2025 | $19,051 | $1,621,482 | $1,621,482 | -- |
| 2024 | $19,051 | $1,589,689 | $1,589,689 | -- |
| 2023 | $18,762 | $1,558,519 | $1,558,519 | $0 |
| 2022 | $18,041 | $1,527,960 | $1,527,960 | $0 |
| 2021 | $3,286 | $255,317 | $245,308 | $10,009 |
| 2020 | $2,832 | $252,699 | $242,793 | $9,906 |
| 2019 | $2,853 | $247,744 | $238,032 | $9,712 |
| 2018 | $2,776 | $242,887 | $233,365 | $9,522 |
| 2017 | $2,729 | $238,124 | $228,789 | $9,335 |
| 2016 | $2,634 | $233,455 | $224,303 | $9,152 |
| 2015 | $2,509 | $229,949 | $220,934 | $9,015 |
| 2014 | $2,509 | $225,444 | $216,606 | $8,838 |
Source: Public Records
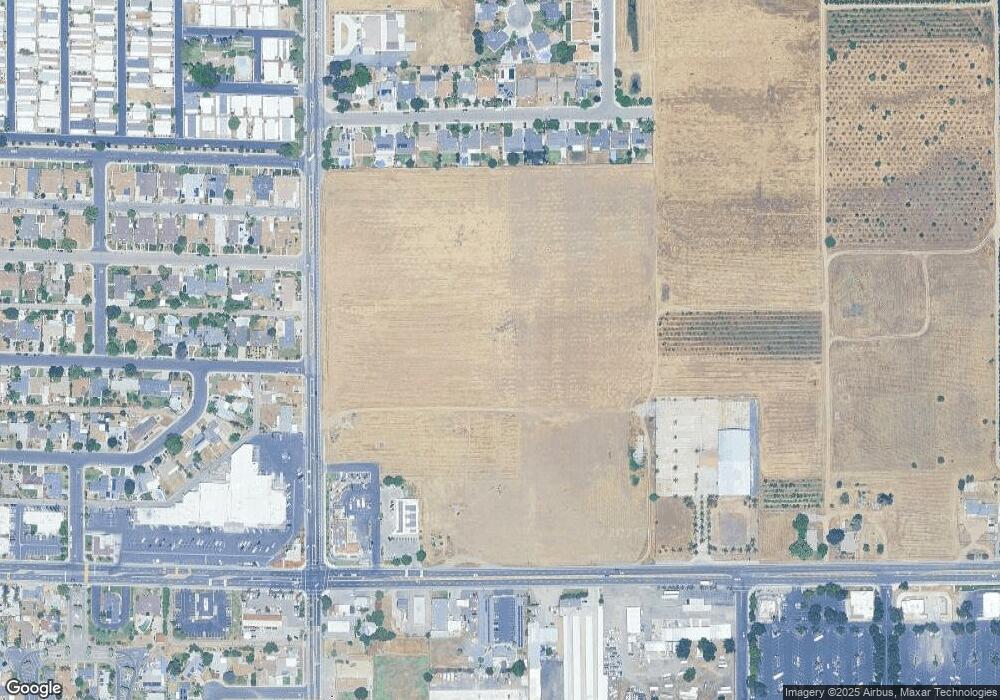
Map
Nearby Homes
- 215 S Gloria Ave
- 1166 E Park Way
- 581 N Crawford Ave Unit 136
- 581 N Crawford Ave Unit 46
- 581 N Crawford Ave Unit 112
- 581 N Crawford Ave Unit 94
- 0 N Hayes Ave
- 65745 Big Meadows Rd
- 223 N H St
- 800 N Whitney Ave
- 2770 E El Monte Way
- 785 E Saginaw Ave
- 789 E Millwood Dr
- 0 E Sequoia Dr
- 42220 Road 92
- 333 N L St
- 225 W Tulare St
- 0 Road 80
- 1981 Dunbar Way
- 397 Amber Ln
- 1410 E El Monte Way
- 970 E El Monte Way
- 1360 E El Monte Way
- 1378 E El Monte Way
- 1330 E El Monte Way
- 1394 E El Monte Way
- 1414 E El Monte Way
- 1375 E El Monte Way
- 1289 E El Monte Way
- 149 S Snyder St
- 1274 E El Monte Way
- 136 S Snyder St
- 1271 E El Monte Way
- 1422 E El Monte Way
- 165 S Snyder St
- 150 S Snyder St
- 161 S Palm Dr
- 120 S California St
- 1340 E Akers Way
- 148 N Hayes Ave