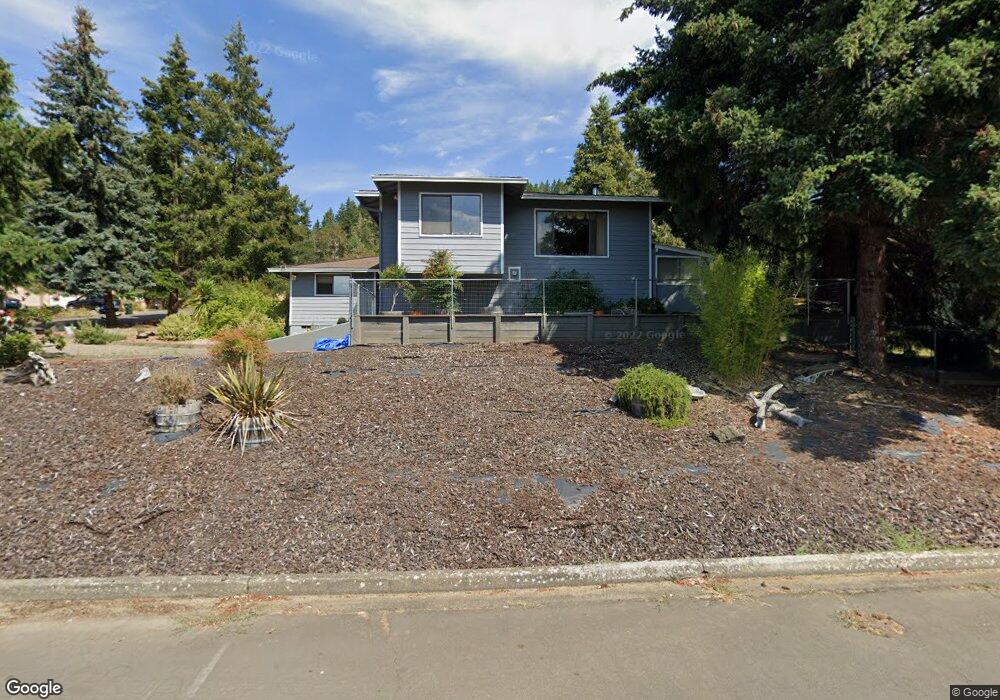
1831 Ruby Ct Sutherlin, OR 97479
Estimated Value: $367,470 - $431,000
3
Beds
2
Baths
1,690
Sq Ft
$235/Sq Ft
Est. Value
About This Home
This home is located at 1831 Ruby Ct, Sutherlin, OR 97479 and is currently estimated at $397,618, approximately $235 per square foot. 1831 Ruby Ct is a home located in Douglas County with nearby schools including East Sutherlin Primary School, West Sutherlin Intermediate School, and Sutherlin Middle School.
Ownership History
Date
Name
Owned For
Owner Type
Purchase Details
Closed on
May 13, 2025
Sold by
Cowan Mark and Cowan Sandra
Bought by
Cowan Family Trust and Cowan
Current Estimated Value
Purchase Details
Closed on
May 19, 2016
Sold by
Armstrong William D and Armstrong Susan G
Bought by
Cowan Mark and Cowan Sandra
Purchase Details
Closed on
Jan 2, 2007
Sold by
Cooper Bernard J
Bought by
Armstrong William D and Armstrong Susan G
Home Financials for this Owner
Home Financials are based on the most recent Mortgage that was taken out on this home.
Original Mortgage
$172,000
Interest Rate
6.16%
Mortgage Type
Purchase Money Mortgage
Purchase Details
Closed on
Aug 25, 2005
Sold by
Aird Philip W and Aird Suzanne Joy
Bought by
Cooper Bernard J
Home Financials for this Owner
Home Financials are based on the most recent Mortgage that was taken out on this home.
Original Mortgage
$217,500
Interest Rate
5.61%
Mortgage Type
Fannie Mae Freddie Mac
Create a Home Valuation Report for This Property
The Home Valuation Report is an in-depth analysis detailing your home's value as well as a comparison with similar homes in the area
Home Values in the Area
Average Home Value in this Area
Purchase History
| Date | Buyer | Sale Price | Title Company |
|---|---|---|---|
| Cowan Family Trust | -- | None Listed On Document | |
| Cowan Mark | $192,000 | First American Title | |
| Armstrong William D | $215,000 | Ticor Title | |
| Cooper Bernard J | $229,000 | Ticor Title |
Source: Public Records
Mortgage History
| Date | Status | Borrower | Loan Amount |
|---|---|---|---|
| Previous Owner | Armstrong William D | $172,000 | |
| Previous Owner | Cooper Bernard J | $217,500 |
Source: Public Records
Tax History
| Year | Tax Paid | Tax Assessment Tax Assessment Total Assessment is a certain percentage of the fair market value that is determined by local assessors to be the total taxable value of land and additions on the property. | Land | Improvement |
|---|---|---|---|---|
| 2025 | $2,662 | $214,985 | -- | -- |
| 2024 | $2,603 | $208,724 | -- | -- |
| 2023 | $2,528 | $202,645 | $0 | $0 |
| 2022 | $2,456 | $196,743 | $0 | $0 |
| 2021 | $2,385 | $191,013 | $0 | $0 |
| 2020 | $2,315 | $185,450 | $0 | $0 |
| 2019 | $2,248 | $180,049 | $0 | $0 |
| 2018 | $2,182 | $174,805 | $0 | $0 |
| 2017 | $2,231 | $169,714 | $0 | $0 |
| 2016 | $2,167 | $164,771 | $0 | $0 |
| 2015 | $2,099 | $159,972 | $0 | $0 |
| 2014 | $2,001 | $152,560 | $0 | $0 |
| 2013 | -- | $148,365 | $0 | $0 |
Source: Public Records
Map
Nearby Homes
- 1774 E Fourth Ave
- 560 St John St
- 1708 Jasper Ave
- 229 N Grove Ln
- 1234 E Fourth Ave
- 1204 E Second Ave
- 1200 E Central Ave Unit 80
- 1200 E Central Ave Unit 84
- 1200 E Central Ave Unit 62
- 402 Northside Rd
- 642 Terrace Ln
- 1000 E Central Ave Unit 21
- 1000 E Central Ave Unit 51
- 776 E Fourth Ave
- 1853 Ridge Water Dr
- 323 Easy St
- 1870 Lakeview Dr
- 0 S Side Rd Unit 604296746
- 662 Brooks Loop
- 845 Forest Heights St
Your Personal Tour Guide
Ask me questions while you tour the home.