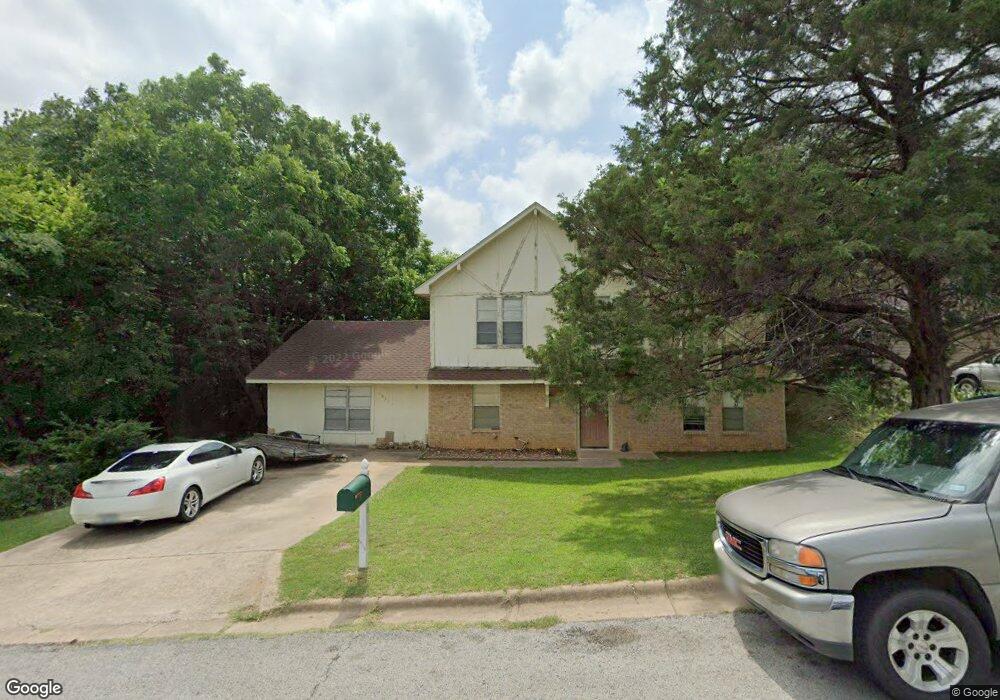
1831 S Travis Ave Denison, TX 75021
Estimated Value: $197,697 - $208,000
3
Beds
2
Baths
1,657
Sq Ft
$122/Sq Ft
Est. Value
About This Home
This home is located at 1831 S Travis Ave, Denison, TX 75021 and is currently estimated at $202,849, approximately $122 per square foot. 1831 S Travis Ave is a home located in Grayson County with nearby schools including Lamar Elementary School, Scott Middle School, and Denison High School.
Ownership History
Date
Name
Owned For
Owner Type
Purchase Details
Closed on
Nov 13, 2009
Sold by
Secretary Of Housing & Urban Development
Bought by
Schultz Misty D and Schultz Gregory R
Current Estimated Value
Home Financials for this Owner
Home Financials are based on the most recent Mortgage that was taken out on this home.
Original Mortgage
$64,158
Outstanding Balance
$41,678
Interest Rate
4.9%
Mortgage Type
FHA
Estimated Equity
$161,171
Purchase Details
Closed on
May 12, 2009
Sold by
Midfirst Bank
Bought by
The Secretary Of Housing & Urban Develop
Purchase Details
Closed on
Mar 3, 2009
Sold by
Portillo Marco A and Portillo Margarita
Bought by
Midfirst Bank
Purchase Details
Closed on
Dec 12, 2005
Sold by
Kimberlin Allen S and Kimberlin Diane B
Bought by
Portillo Marco A and Portillo Margarita
Home Financials for this Owner
Home Financials are based on the most recent Mortgage that was taken out on this home.
Original Mortgage
$94,254
Interest Rate
6.29%
Mortgage Type
FHA
Create a Home Valuation Report for This Property
The Home Valuation Report is an in-depth analysis detailing your home's value as well as a comparison with similar homes in the area
Home Values in the Area
Average Home Value in this Area
Purchase History
| Date | Buyer | Sale Price | Title Company |
|---|---|---|---|
| Schultz Misty D | -- | Red River Title Co | |
| The Secretary Of Housing & Urban Develop | -- | None Available | |
| Midfirst Bank | $104,044 | None Available | |
| Portillo Marco A | -- | None Available |
Source: Public Records
Mortgage History
| Date | Status | Borrower | Loan Amount |
|---|---|---|---|
| Open | Schultz Misty D | $64,158 | |
| Previous Owner | Portillo Marco A | $94,254 |
Source: Public Records
Tax History Compared to Growth
Tax History
| Year | Tax Paid | Tax Assessment Tax Assessment Total Assessment is a certain percentage of the fair market value that is determined by local assessors to be the total taxable value of land and additions on the property. | Land | Improvement |
|---|---|---|---|---|
| 2025 | $1,935 | $133,263 | $35,342 | $97,921 |
| 2024 | $3,179 | $136,834 | $29,289 | $107,545 |
| 2023 | $1,695 | $130,016 | $0 | $0 |
| 2022 | $2,808 | $118,196 | $0 | $0 |
| 2021 | $2,710 | $107,451 | $14,192 | $93,259 |
| 2020 | $2,763 | $104,757 | $14,192 | $90,565 |
| 2019 | $2,782 | $101,113 | $9,322 | $91,791 |
| 2018 | $2,770 | $104,130 | $9,322 | $94,808 |
| 2017 | $2,539 | $90,766 | $9,322 | $81,444 |
| 2016 | $2,488 | $95,198 | $9,322 | $85,876 |
| 2015 | $1,830 | $80,851 | $5,913 | $74,938 |
| 2014 | $1,980 | $80,851 | $5,913 | $74,938 |
Source: Public Records
Map
Nearby Homes
- 1901 S Lamar Ave
- 1903 S Lamar Ave
- 1905 S Lamar Ave
- 1506 S Travis St
- 153 Circle Dr
- TBD Bells Dr
- 1414 S Houston Ave
- 101 E Murray St
- 705 E Hanna St
- 721 E Bullock St
- 111 W Murray St
- 715 E Hanna St
- 732 E Bullock St
- TBD E Heron St
- 401 E Monterey St
- 415 E Monterey St
- 621 E Murray St
- 231 W Murray St
- 622 E Heron St
- TBD S Austin Ave
- 1827 S Travis Ave
- 1813 S Travis Ave
- 1830 S Travis Ave
- 1826 S Travis Ave
- 400 E Burrell St
- 1818 S Travis Ave
- 404 E Burrell St
- 1812 S Travis Ave
- 1805 S Travis Ave
- 408 E Burrell St
- 1829 S Center St
- 1825 S Center St
- 1819 S Center St
- 1806 S Travis Ave
- 412 E Burrell St
- 230 Harrison St
- 1801 S Travis Ave
- 1813 S Center St
- 416 E Burrell St
- 1800 S Travis Ave