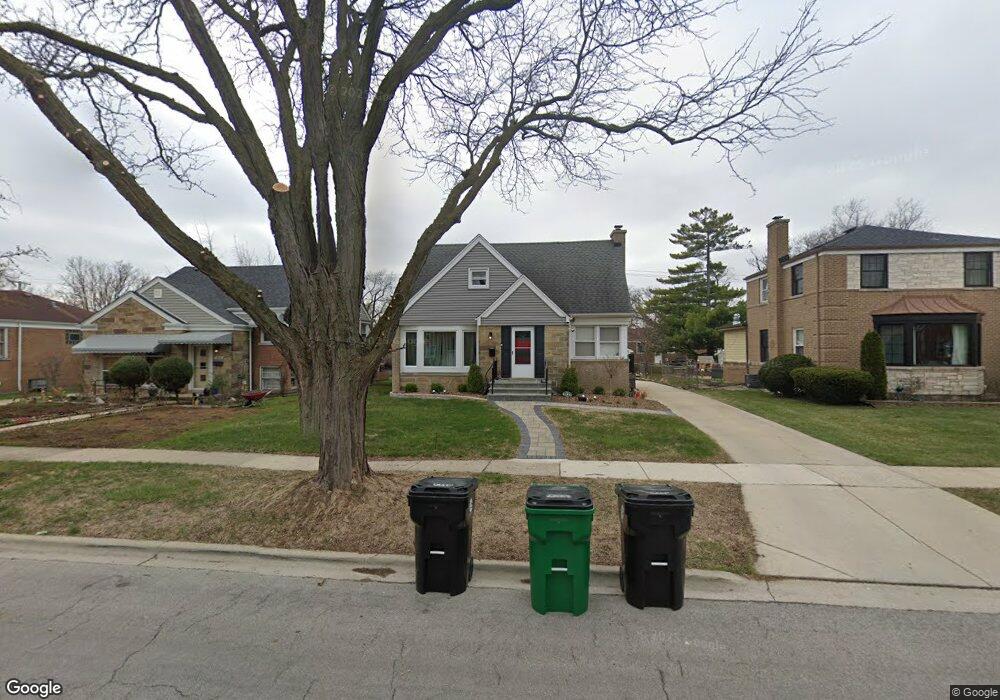
1832 Hull Ave Westchester, IL 60154
Estimated Value: $403,000 - $476,000
4
Beds
1
Bath
2,211
Sq Ft
$197/Sq Ft
Est. Value
About This Home
This home is located at 1832 Hull Ave, Westchester, IL 60154 and is currently estimated at $435,933, approximately $197 per square foot. 1832 Hull Ave is a home located in Cook County with nearby schools including Westchester Primary School, Westchester Intermediate School, and Westchester Middle School.
Ownership History
Date
Name
Owned For
Owner Type
Purchase Details
Closed on
Oct 1, 2004
Sold by
Hribal Gregory P and Hribal Sarah M
Bought by
Hribal Gregory P and Hribal Sarah M
Current Estimated Value
Purchase Details
Closed on
Apr 26, 2004
Sold by
Tobias William J and Tobias Julie M
Bought by
Hribal Gregory P and Wilson Sarah M
Home Financials for this Owner
Home Financials are based on the most recent Mortgage that was taken out on this home.
Original Mortgage
$208,000
Outstanding Balance
$97,248
Interest Rate
5.46%
Mortgage Type
Unknown
Estimated Equity
$338,685
Purchase Details
Closed on
Feb 20, 2001
Sold by
Maloney Thomas J
Bought by
Tobias William J and Tobias Julie M
Home Financials for this Owner
Home Financials are based on the most recent Mortgage that was taken out on this home.
Original Mortgage
$147,150
Interest Rate
7.02%
Create a Home Valuation Report for This Property
The Home Valuation Report is an in-depth analysis detailing your home's value as well as a comparison with similar homes in the area
Home Values in the Area
Average Home Value in this Area
Purchase History
| Date | Buyer | Sale Price | Title Company |
|---|---|---|---|
| Hribal Gregory P | -- | Chicago Title Insurance Comp | |
| Hribal Gregory P | $260,000 | Chicago Title Insurance Comp | |
| Tobias William J | $163,500 | -- |
Source: Public Records
Mortgage History
| Date | Status | Borrower | Loan Amount |
|---|---|---|---|
| Open | Hribal Gregory P | $208,000 | |
| Previous Owner | Tobias William J | $147,150 |
Source: Public Records
Tax History Compared to Growth
Tax History
| Year | Tax Paid | Tax Assessment Tax Assessment Total Assessment is a certain percentage of the fair market value that is determined by local assessors to be the total taxable value of land and additions on the property. | Land | Improvement |
|---|---|---|---|---|
| 2024 | $7,528 | $32,000 | $4,445 | $27,555 |
| 2023 | $6,692 | $32,000 | $4,445 | $27,555 |
| 2022 | $6,692 | $25,355 | $3,810 | $21,545 |
| 2021 | $6,504 | $25,355 | $3,810 | $21,545 |
| 2020 | $6,420 | $25,355 | $3,810 | $21,545 |
| 2019 | $6,014 | $24,718 | $3,492 | $21,226 |
| 2018 | $5,934 | $24,718 | $3,492 | $21,226 |
| 2017 | $5,836 | $24,718 | $3,492 | $21,226 |
| 2016 | $5,166 | $20,209 | $3,175 | $17,034 |
| 2015 | $5,063 | $20,209 | $3,175 | $17,034 |
| 2014 | $4,961 | $20,209 | $3,175 | $17,034 |
| 2013 | $5,227 | $23,422 | $3,175 | $20,247 |
Source: Public Records
Map
Nearby Homes
- 1803 Balmoral Ave
- 1907 Suffolk Ave
- 10324 Wight St
- 1816 Manchester Ave
- 1900 Manchester Ave
- 1813 Manchester Ave
- 1908 Belleview Ave
- 1840 Gardner Rd
- 1406 Portsmouth Ave
- 10461 Dorchester St
- 1500 Bristol Ave
- 1318 Balmoral Ave
- 10567 Waterford Dr
- 1244 Westchester Blvd
- 10531 Camelot St
- 1921 Buckingham Ave
- 10524 Camelot St
- 1860 Buckingham Ave
- 1245 S Mannheim Rd Unit 2
- 1247 S Mannheim Rd Unit 3
- 1826 Hull Ave
- 1836 Hull Ave
- 1820 Hull Ave
- 1829 Westchester Blvd
- 1839 Westchester Blvd
- 1839 Westchester Blvd
- 1816 Hull Ave
- 1823 Westchester Blvd
- 1846 Hull Ave
- 1845 Westchester Blvd
- 1817 Westchester Blvd
- 1833 Hull Ave
- 1852 Hull Ave
- 1812 Hull Ave
- 1827 Hull Ave
- 1837 Hull Ave
- 1823 Hull Ave
- 1851 Westchester Blvd
- 1843 Hull Ave
- 1856 Hull Ave