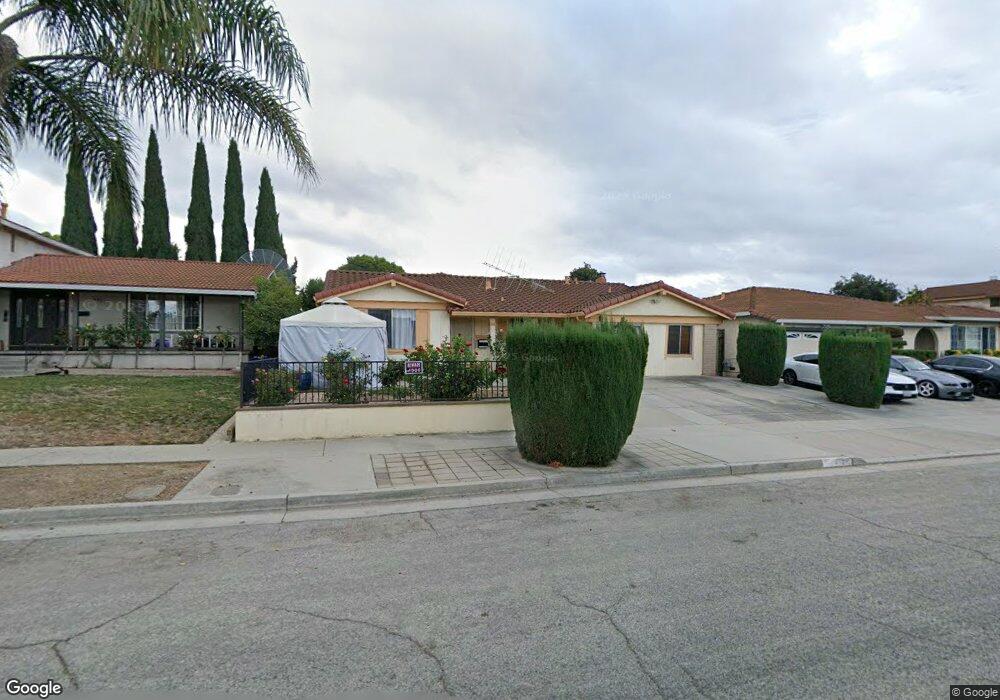
1832 Ribisi Way San Jose, CA 95131
Vinci South NeighborhoodEstimated Value: $1,631,049 - $1,850,000
5
Beds
2
Baths
1,843
Sq Ft
$957/Sq Ft
Est. Value
About This Home
This home is located at 1832 Ribisi Way, San Jose, CA 95131 and is currently estimated at $1,764,016, approximately $957 per square foot. 1832 Ribisi Way is a home located in Santa Clara County with nearby schools including Vinci Park Elementary School, Morrill Middle School, and Independence High School.
Ownership History
Date
Name
Owned For
Owner Type
Purchase Details
Closed on
Jul 24, 2017
Sold by
Chun Stephanie
Bought by
Chun Stephanie
Current Estimated Value
Purchase Details
Closed on
Aug 17, 2012
Sold by
Chun Louise and Chun Stephanie
Bought by
Chun Louise and Chun Stephanie
Home Financials for this Owner
Home Financials are based on the most recent Mortgage that was taken out on this home.
Original Mortgage
$75,000
Outstanding Balance
$32,006
Interest Rate
3.49%
Mortgage Type
New Conventional
Estimated Equity
$1,732,010
Purchase Details
Closed on
Mar 11, 2010
Sold by
Chun Richard G H and Chun Louise T L
Bought by
Chun Louise T L and Chun Stephanie
Purchase Details
Closed on
Nov 16, 2000
Sold by
Chun Richard G and Chun Louise T
Bought by
Chun Richard G H and Chun Louise T L
Create a Home Valuation Report for This Property
The Home Valuation Report is an in-depth analysis detailing your home's value as well as a comparison with similar homes in the area
Home Values in the Area
Average Home Value in this Area
Purchase History
| Date | Buyer | Sale Price | Title Company |
|---|---|---|---|
| Chun Stephanie | -- | None Available | |
| Chun Louise | -- | First American Title | |
| Chun Louise T L | -- | None Available | |
| Chun Richard G H | -- | -- |
Source: Public Records
Mortgage History
| Date | Status | Borrower | Loan Amount |
|---|---|---|---|
| Open | Chun Louise | $75,000 |
Source: Public Records
Tax History Compared to Growth
Tax History
| Year | Tax Paid | Tax Assessment Tax Assessment Total Assessment is a certain percentage of the fair market value that is determined by local assessors to be the total taxable value of land and additions on the property. | Land | Improvement |
|---|---|---|---|---|
| 2025 | $3,205 | $137,568 | $24,454 | $113,114 |
| 2024 | $3,205 | $134,872 | $23,975 | $110,897 |
| 2023 | $3,107 | $132,228 | $23,505 | $108,723 |
| 2022 | $3,080 | $129,637 | $23,045 | $106,592 |
| 2021 | $2,941 | $127,096 | $22,594 | $104,502 |
| 2020 | $2,817 | $125,794 | $22,363 | $103,431 |
| 2019 | $2,702 | $123,328 | $21,925 | $101,403 |
| 2018 | $2,646 | $120,911 | $21,496 | $99,415 |
| 2017 | $2,632 | $118,541 | $21,075 | $97,466 |
| 2016 | $2,517 | $116,217 | $20,662 | $95,555 |
| 2015 | $2,476 | $114,472 | $20,352 | $94,120 |
| 2014 | $2,013 | $112,231 | $19,954 | $92,277 |
Source: Public Records
Map
Nearby Homes
- 2044 Voss Park Ln
- 1049 Branbury Way
- 1146 Rosebriar Way
- 1713 Winston St
- 1824 Seville Way
- 1210 Briarcreek Ct
- 1087 Yarrow Terrace
- 1809 Sageland Dr
- 1055 Thyme Walkway
- 1137 Mallow Terrace
- 1660 Solari Place
- 1027 Giacomo Ln Unit 7
- 2109 Kiwi Walkway
- 1337 Araujo St
- 1233 Briarleaf Cir
- 1036 Onofrio Ln Unit 6
- 1957 Cape Horn Dr
- 1968 Nutmeg Ct
- 1767 Clove Ct
- 1538 Neleigh Place
- 1822 Ribisi Way
- 1842 Ribisi Way
- 1815 Wintersong Ct
- 1811 Wintersong Ct
- 1819 Wintersong Ct
- 1812 Ribisi Way
- 1852 Ribisi Way
- 1807 Wintersong Ct
- 1823 Wintersong Ct
- 1835 Ribisi Way
- 1825 Ribisi Way
- 1845 Ribisi Way
- 1862 Ribisi Way
- 1802 Ribisi Way
- 1815 Ribisi Way
- 1855 Ribisi Way
- 1827 Wintersong Ct
- 1803 Wintersong Ct
- 1805 Ribisi Way
- 1872 Ribisi Way