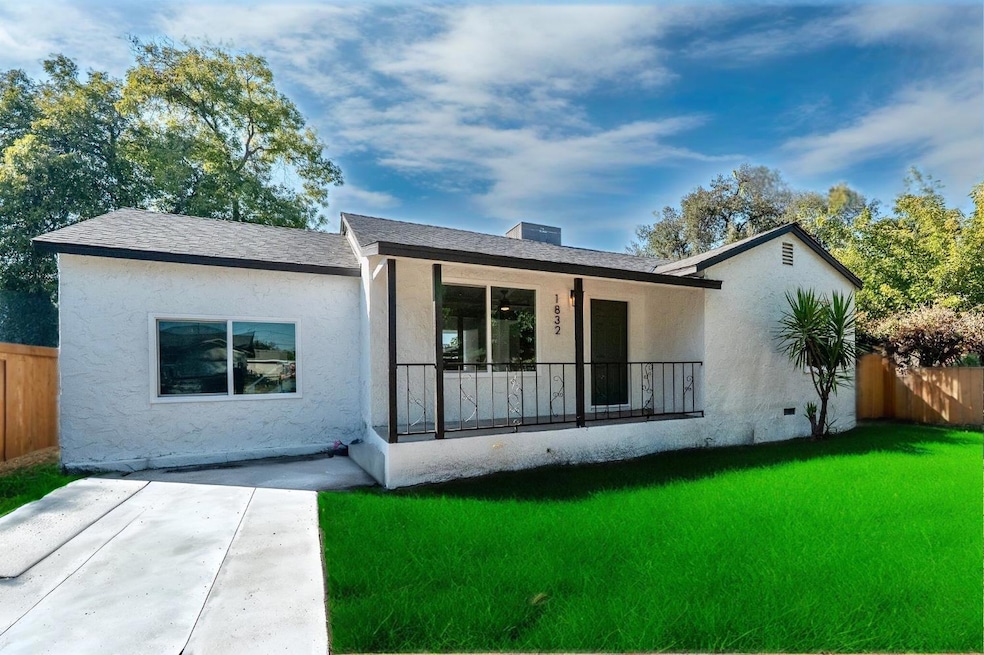
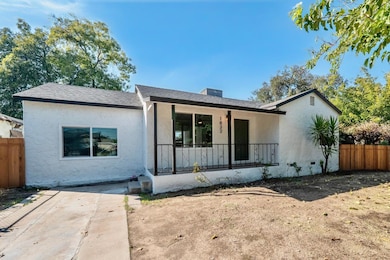
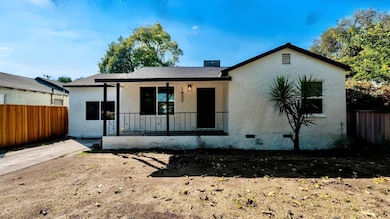

1832 S Gearhart St Fresno, CA 93702
Huntington NeighborhoodEstimated payment $1,434/month
Highlights
- Very Popular Property
- Bathtub with Shower
- 1-Story Property
- Double Pane Windows
- Tile Flooring
- Central Heating and Cooling System
About This Home
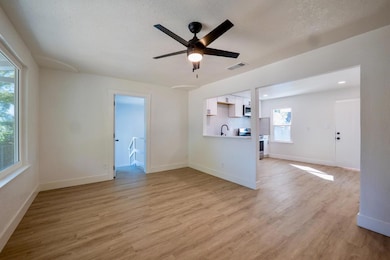
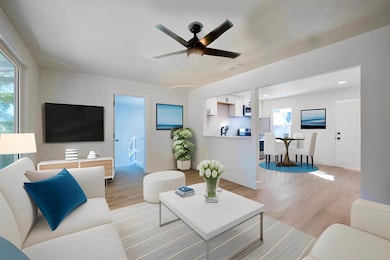
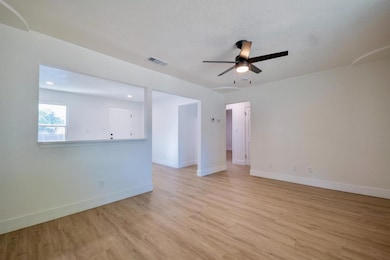
Completely Updated Fresno Charmer!Welcome to this beautifully refreshed home offering modern comfort, style, and incredible value. From the moment you arrive, you'll notice the fresh exterior paint and new roof that set the tone for what's inside. Step into an inviting open layout featuring all-new LVP flooring, dual-pane windows, fresh interior paint, and stylish fixtures throughout. The kitchen shines with brand-new countertops, stainless steel appliances, and a gas range perfect for home cooking and entertaining. The bathroom has been fully remodeled with updated tile and contemporary finishes. With a newly added third bedroom and a spacious backyard, this home provides flexibility for families, first-time buyers, or investors seeking a turnkey rental opportunity. Enjoy the comfort of a new HVAC system, and the peace of mind that comes with a home thoughtfully updated inside and out. Conveniently located near schools, parks, and freeway access; this is Fresno living at its best!
Home Details
Home Type
- Single Family
Est. Annual Taxes
- $569
Year Built
- Built in 1947
Lot Details
- 6,350 Sq Ft Lot
- Lot Dimensions are 50x127
- Property is zoned RS5
Parking
- Carport
Home Design
- Concrete Foundation
- Composition Roof
- Wood Siding
- Stucco
Interior Spaces
- 819 Sq Ft Home
- 1-Story Property
- Double Pane Windows
- Laundry in unit
Kitchen
- Oven or Range
- Microwave
Flooring
- Tile
- Vinyl
Bedrooms and Bathrooms
- 3 Bedrooms
- 1 Bathroom
- Bathtub with Shower
Utilities
- Central Heating and Cooling System
Map
Home Values in the Area
Average Home Value in this Area
Tax History
| Year | Tax Paid | Tax Assessment Tax Assessment Total Assessment is a certain percentage of the fair market value that is determined by local assessors to be the total taxable value of land and additions on the property. | Land | Improvement |
|---|---|---|---|---|
| 2025 | $569 | $42,788 | $8,743 | $34,045 |
| 2023 | $569 | $41,128 | $8,404 | $32,724 |
| 2022 | $552 | $40,323 | $8,240 | $32,083 |
| 2021 | $537 | $39,533 | $8,079 | $31,454 |
| 2020 | $535 | $39,129 | $7,997 | $31,132 |
| 2019 | $516 | $38,363 | $7,841 | $30,522 |
| 2018 | $505 | $37,612 | $7,688 | $29,924 |
| 2017 | $497 | $36,876 | $7,538 | $29,338 |
| 2016 | $395 | $36,154 | $7,391 | $28,763 |
| 2015 | $389 | $35,611 | $7,280 | $28,331 |
| 2014 | $378 | $34,915 | $7,138 | $27,777 |
Property History
| Date | Event | Price | List to Sale | Price per Sq Ft |
|---|---|---|---|---|
| 10/29/2025 10/29/25 | For Sale | $265,000 | -- | $324 / Sq Ft |
Purchase History
| Date | Type | Sale Price | Title Company |
|---|---|---|---|
| Deed | -- | Chicago Title | |
| Grant Deed | $120,000 | Chicago Title | |
| Interfamily Deed Transfer | -- | None Available | |
| Interfamily Deed Transfer | -- | -- |
Mortgage History
| Date | Status | Loan Amount | Loan Type |
|---|---|---|---|
| Open | $188,300 | Construction |
Source: Fresno MLS
MLS Number: 639066
APN: 471-183-05
Disclaimer: Certain information contained herein is derived from information provided by parties other than Homes.com. All information provided is deemed reliable, but is not guaranteed to be accurate and should be independently verified.
![]() IDX information is provided exclusively for personal, non-commercial use, and may not be used for any purpose other than to identify prospective properties consumers may be interested in purchasing. Information is deemed reliable but not guaranteed.
IDX information is provided exclusively for personal, non-commercial use, and may not be used for any purpose other than to identify prospective properties consumers may be interested in purchasing. Information is deemed reliable but not guaranteed.
- 1929 S 5th St
- 3645 E Hamilton Ave
- 2060 S Fifth St
- 1325 S 4th St
- 3231 E Townsend Ave
- 3919 E Butler Ave
- 1209 S 3rd St
- 3626 E Lowe Ave
- 3922 E Lyell Ave
- 1246 S 2nd St
- 4002 E Lyell Ave
- 3819 E Belgravia Ave
- 3581 E Alta Ave
- 2071 S Cedar Ave
- 832 S 4th St
- 3321 E Montecito Ave
- 725 S 5th St
- 2343 S Orinda St
- 1456 S Chance Ave
- 3436 E Mono St
- 2255 S Maple Ave
- 2890 Huntington Blvd Unit 105
- 2909 Huntington Blvd Unit 105
- 2553 S Holloway Ave Unit 102
- 942 N Van Ness Ave
- 205 N Mariposa St
- 1151 S Chestnut Ave
- 4860 E Lane Ave
- 512 S Dearing Ave Unit 102
- 1560 Fulton St
- 1133 E Divisadero St Unit Apartment
- 1824 Fulton St
- 1540 B St
- 3935 E Clay Ave Unit 201
- 1901 Fulton St
- 5120 E Kings Canyon Rd
- 15 E San Joaquin St
- 11 E San Joaquin St
- 938 N Van Ness Ave
- 1060 Fulton St Unit View Suite
