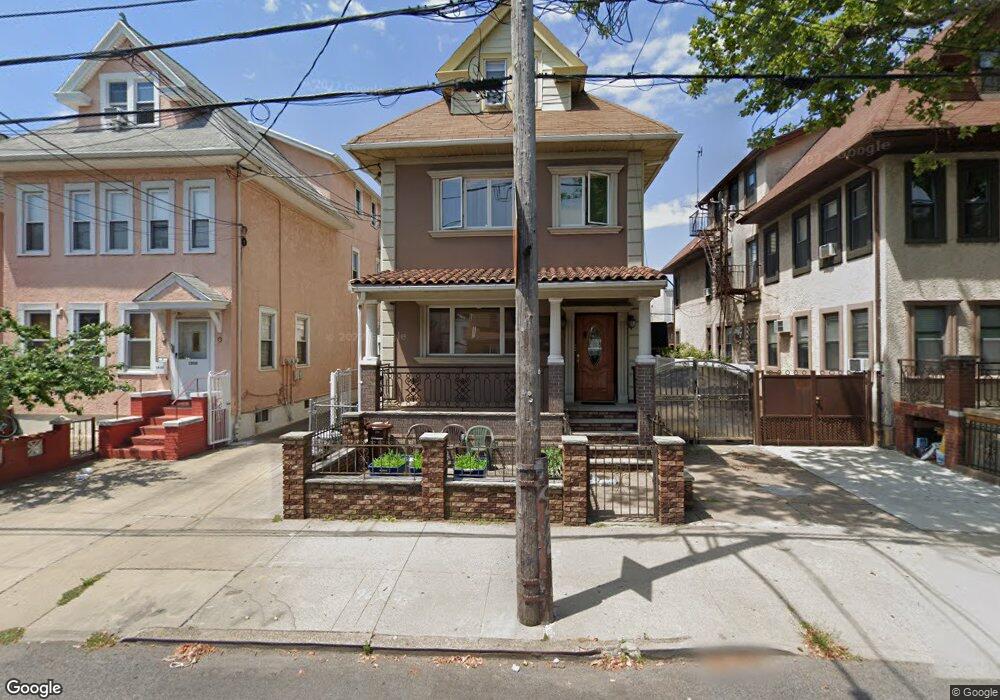
1832 W 11th St Unit 3F Brooklyn, NY 11223
Gravesend NeighborhoodEstimated Value: $1,739,000 - $2,055,000
2
Beds
1
Bath
800
Sq Ft
$2,387/Sq Ft
Est. Value
About This Home
This home is located at 1832 W 11th St Unit 3F, Brooklyn, NY 11223 and is currently estimated at $1,909,569, approximately $2,386 per square foot. 1832 W 11th St Unit 3F is a home located in Kings County with nearby schools including P.S. 97 - The Highlawn, Is 228 David A Boody, and Hebrew Language Academy Charter 2.
Ownership History
Date
Name
Owned For
Owner Type
Purchase Details
Closed on
Aug 15, 2013
Sold by
Chan Jinwah
Bought by
Cheung Nina
Current Estimated Value
Purchase Details
Closed on
Jul 25, 2011
Sold by
Gambella Kelly Ann D
Bought by
Chan Jinwah and Cheung Nina
Home Financials for this Owner
Home Financials are based on the most recent Mortgage that was taken out on this home.
Original Mortgage
$640,000
Interest Rate
4.51%
Mortgage Type
Purchase Money Mortgage
Purchase Details
Closed on
Aug 22, 2005
Sold by
D'Onorio Demeo Giuseppina
Bought by
Gambella Kellyann D and Gambella Nicholas F
Home Financials for this Owner
Home Financials are based on the most recent Mortgage that was taken out on this home.
Original Mortgage
$505,000
Interest Rate
5.81%
Mortgage Type
Purchase Money Mortgage
Create a Home Valuation Report for This Property
The Home Valuation Report is an in-depth analysis detailing your home's value as well as a comparison with similar homes in the area
Home Values in the Area
Average Home Value in this Area
Purchase History
| Date | Buyer | Sale Price | Title Company |
|---|---|---|---|
| Cheung Nina | -- | -- | |
| Chan Jinwah | $999,999 | -- | |
| Gambella Kellyann D | $755,000 | -- |
Source: Public Records
Mortgage History
| Date | Status | Borrower | Loan Amount |
|---|---|---|---|
| Previous Owner | Chan Jinwah | $640,000 | |
| Previous Owner | Gambella Kellyann D | $505,000 |
Source: Public Records
Tax History Compared to Growth
Tax History
| Year | Tax Paid | Tax Assessment Tax Assessment Total Assessment is a certain percentage of the fair market value that is determined by local assessors to be the total taxable value of land and additions on the property. | Land | Improvement |
|---|---|---|---|---|
| 2025 | $10,967 | $100,980 | $20,160 | $80,820 |
| 2024 | $10,967 | $107,580 | $20,160 | $87,420 |
| 2023 | $10,478 | $97,320 | $20,160 | $77,160 |
| 2022 | $10,200 | $86,340 | $20,160 | $66,180 |
| 2021 | $10,149 | $91,680 | $20,160 | $71,520 |
| 2020 | $5,045 | $95,940 | $20,160 | $75,780 |
| 2019 | $9,519 | $99,120 | $20,160 | $78,960 |
| 2018 | $8,765 | $42,996 | $10,416 | $32,580 |
| 2017 | $8,679 | $42,577 | $11,004 | $31,573 |
| 2016 | $8,034 | $40,188 | $11,338 | $28,850 |
| 2015 | $4,625 | $40,185 | $15,630 | $24,555 |
| 2014 | $4,625 | $37,920 | $12,788 | $25,132 |
Source: Public Records
Map
Nearby Homes