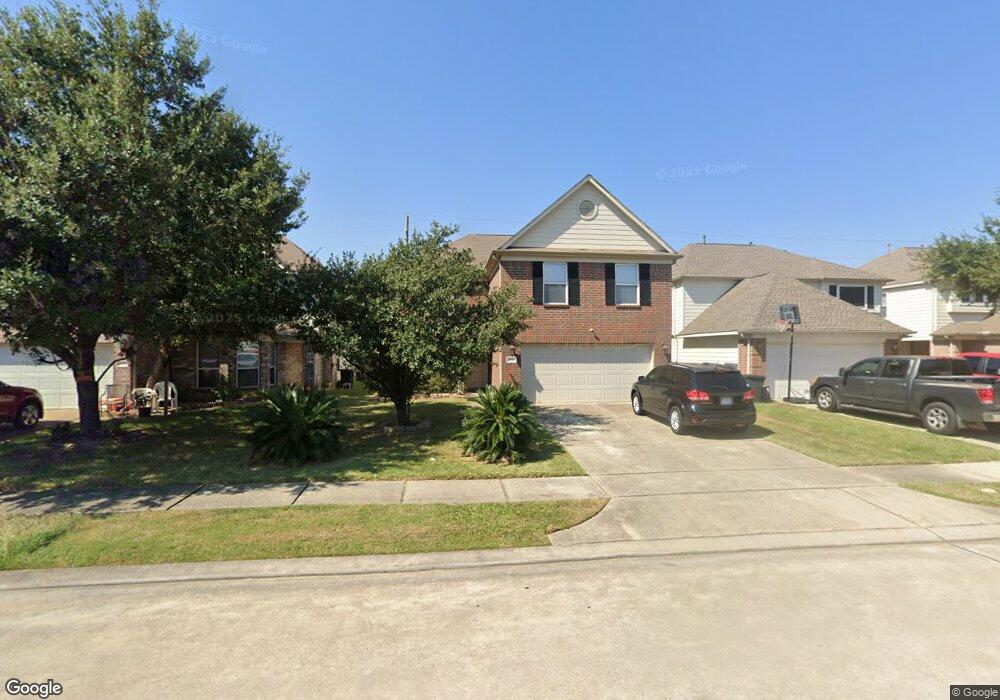
18327 Ranch View Trail Houston, TX 77073
Northview NeighborhoodEstimated Value: $285,000 - $320,000
4
Beds
3
Baths
3,164
Sq Ft
$95/Sq Ft
Est. Value
About This Home
This home is located at 18327 Ranch View Trail, Houston, TX 77073 and is currently estimated at $299,022, approximately $94 per square foot. 18327 Ranch View Trail is a home located in Harris County with nearby schools including Aldine Young Women's Leadership Academy, Davis Ninth Grade, and Teague Middle School.
Ownership History
Date
Name
Owned For
Owner Type
Purchase Details
Closed on
Jan 29, 2020
Sold by
Czirr Investments Llc
Bought by
Bell Tabbatha Jean
Current Estimated Value
Home Financials for this Owner
Home Financials are based on the most recent Mortgage that was taken out on this home.
Original Mortgage
$199,323
Outstanding Balance
$181,201
Interest Rate
5.12%
Mortgage Type
FHA
Estimated Equity
$117,821
Purchase Details
Closed on
Sep 12, 2019
Sold by
Copes Allen Michael and Copes Consuelo Knott
Bought by
Czirr Investments Llc
Purchase Details
Closed on
Nov 18, 2010
Sold by
Davenport Chaka
Bought by
Copes Allen Michael and Copes Consuelo Knott
Home Financials for this Owner
Home Financials are based on the most recent Mortgage that was taken out on this home.
Original Mortgage
$118,000
Interest Rate
4.27%
Mortgage Type
VA
Purchase Details
Closed on
Feb 26, 2009
Sold by
Long Lake Ltd
Bought by
Davenport Chaka
Home Financials for this Owner
Home Financials are based on the most recent Mortgage that was taken out on this home.
Original Mortgage
$122,853
Interest Rate
5.13%
Mortgage Type
FHA
Create a Home Valuation Report for This Property
The Home Valuation Report is an in-depth analysis detailing your home's value as well as a comparison with similar homes in the area
Home Values in the Area
Average Home Value in this Area
Purchase History
| Date | Buyer | Sale Price | Title Company |
|---|---|---|---|
| Bell Tabbatha Jean | -- | Momentum Title Llc | |
| Czirr Investments Llc | -- | None Available | |
| Copes Allen Michael | -- | First American Title | |
| Davenport Chaka | -- | American Title Company |
Source: Public Records
Mortgage History
| Date | Status | Borrower | Loan Amount |
|---|---|---|---|
| Open | Bell Tabbatha Jean | $199,323 | |
| Previous Owner | Copes Allen Michael | $118,000 | |
| Previous Owner | Davenport Chaka | $122,853 |
Source: Public Records
Tax History Compared to Growth
Tax History
| Year | Tax Paid | Tax Assessment Tax Assessment Total Assessment is a certain percentage of the fair market value that is determined by local assessors to be the total taxable value of land and additions on the property. | Land | Improvement |
|---|---|---|---|---|
| 2025 | $6,263 | $303,725 | $50,904 | $252,821 |
| 2024 | $6,263 | $306,847 | $50,904 | $255,943 |
| 2023 | $6,263 | $335,880 | $50,904 | $284,976 |
| 2022 | $7,098 | $287,657 | $27,216 | $260,441 |
| 2021 | $6,749 | $237,254 | $27,216 | $210,038 |
| 2020 | $6,506 | $211,132 | $27,216 | $183,916 |
| 2019 | $6,113 | $201,528 | $27,216 | $174,312 |
| 2018 | $1,976 | $172,635 | $27,216 | $145,419 |
| 2017 | $10,771 | $165,381 | $27,216 | $138,165 |
| 2016 | $5,266 | $165,381 | $27,216 | $138,165 |
| 2015 | $4,217 | $147,012 | $27,216 | $119,796 |
| 2014 | $4,217 | $147,012 | $27,216 | $119,796 |
Source: Public Records
Map
Nearby Homes
- 18302 Apple Bud Ct
- 0 Hardy Rd 28B Hardy St
- tbd Hardy St
- 0 Hardy Rd
- 18414 W Hardy Rd
- 922 Steel Blue Dr
- 189 Hardy St
- 0 W Hardy 31b Rd Unit 86879374
- Airtex Hardy Airtex Rd
- 0 Hardy Rd 10133 Lt Rd N Unit 17538465
- 0 Hardy Rd 10133 Lt Z Rd
- 0 Rd Unit 57900160
- 0 Hardy Rd 10133 Lt M Rd
- 1218 Goodnight Trail
- 0 Hardy Rd 10133 Lt X Rd
- 0 Hardy Rd 10133 Lt L Rd
- T B D W Hardy Rd
- 0 Hardy Rd 10133 Lt Rd W Unit 16973610
- 0 Hardy Rd 10133 Lt K Rd
- 0 Hardy Rd 10133 Lt V Rd
- 18331 Ranch View Trail
- 18323 Ranch View Trail
- 18319 Ranch View Trail
- 18335 Ranch View Trail
- 18403 Ranch View Trail
- 18315 Ranch View Trail
- 1002 Thicket Hill Ct
- 1003 Stable Side Ct
- 18407 Ranch View Trail
- 1006 Thicket Hill Ct
- 1003 Thicket Hill Ct
- 1007 Stable Side Ct
- 18411 Ranch View Trail
- 18307 Ranch View Trail
- 1010 Thicket Hill Ct
- 1011 Stable Side Ct
- 1007 Thicket Hill Ct
- 18303 Ranch View Trail
- 18415 Ranch View Trail
- 1002 Stable Side Ct