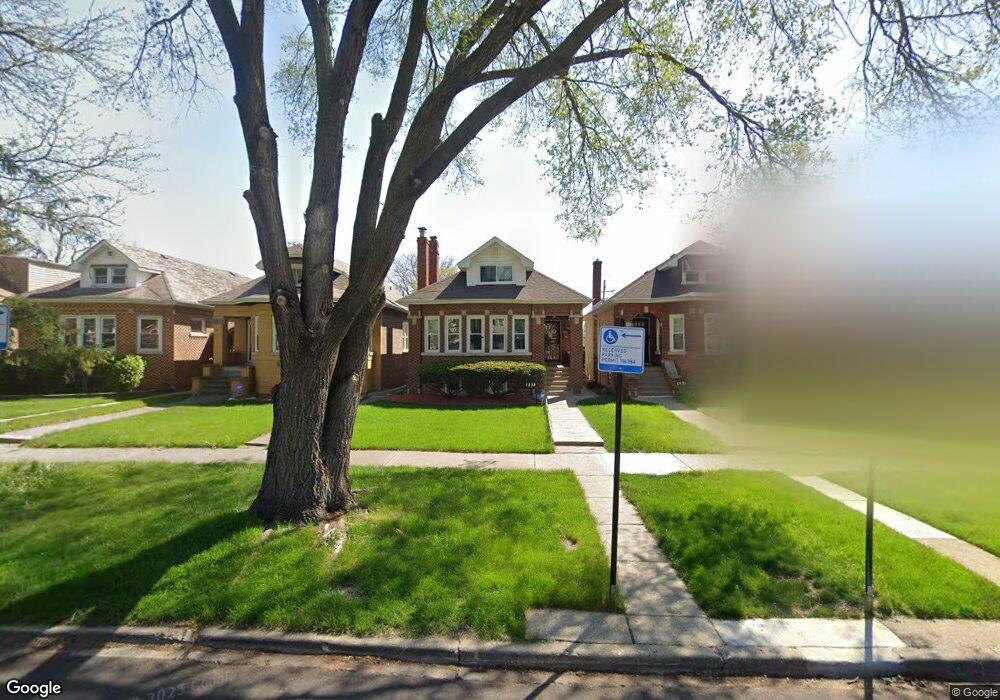
1833 N Nagle Ave Chicago, IL 60707
Galewood NeighborhoodEstimated Value: $363,353 - $485,000
7
Beds
3
Baths
1,254
Sq Ft
$337/Sq Ft
Est. Value
About This Home
This home is located at 1833 N Nagle Ave, Chicago, IL 60707 and is currently estimated at $422,338, approximately $336 per square foot. 1833 N Nagle Ave is a home located in Cook County with nearby schools including Lovett Elementary School, Steinmetz College Prep, and Acero - Roberto Clemente Elementary School.
Ownership History
Date
Name
Owned For
Owner Type
Purchase Details
Closed on
Sep 1, 2017
Sold by
Montes Jose A and Montes Ilia Y
Bought by
Buggs Ebony D and Williams Diane
Current Estimated Value
Home Financials for this Owner
Home Financials are based on the most recent Mortgage that was taken out on this home.
Original Mortgage
$270,019
Outstanding Balance
$224,168
Interest Rate
3.95%
Mortgage Type
FHA
Estimated Equity
$198,170
Purchase Details
Closed on
Mar 14, 2007
Sold by
Montes Jose A and Montes Ilia Y
Bought by
Montes Jose A and Montes Ilia Y
Home Financials for this Owner
Home Financials are based on the most recent Mortgage that was taken out on this home.
Original Mortgage
$384,750
Interest Rate
7.99%
Mortgage Type
New Conventional
Purchase Details
Closed on
Feb 9, 1996
Sold by
Rabe Judith K
Bought by
Watt Reacy and Watt Sallie
Home Financials for this Owner
Home Financials are based on the most recent Mortgage that was taken out on this home.
Original Mortgage
$108,800
Interest Rate
7.07%
Create a Home Valuation Report for This Property
The Home Valuation Report is an in-depth analysis detailing your home's value as well as a comparison with similar homes in the area
Home Values in the Area
Average Home Value in this Area
Purchase History
| Date | Buyer | Sale Price | Title Company |
|---|---|---|---|
| Buggs Ebony D | $275,000 | Saturn Title Llc | |
| Montes Jose A | -- | Law Title Insurance Co Inc | |
| Watt Reacy | $204,000 | 1St American Title |
Source: Public Records
Mortgage History
| Date | Status | Borrower | Loan Amount |
|---|---|---|---|
| Open | Buggs Ebony D | $270,019 | |
| Previous Owner | Montes Jose A | $384,750 | |
| Previous Owner | Watt Reacy | $108,800 |
Source: Public Records
Tax History
| Year | Tax Paid | Tax Assessment Tax Assessment Total Assessment is a certain percentage of the fair market value that is determined by local assessors to be the total taxable value of land and additions on the property. | Land | Improvement |
|---|---|---|---|---|
| 2025 | $3,804 | $31,000 | $15,998 | $15,002 |
| 2024 | $3,804 | $31,000 | $15,998 | $15,002 |
| 2023 | $3,682 | $22,000 | $11,323 | $10,677 |
| 2022 | $3,682 | $22,000 | $11,323 | $10,677 |
| 2021 | $3,622 | $21,997 | $11,321 | $10,676 |
| 2020 | $4,165 | $22,407 | $6,473 | $15,934 |
| 2019 | $4,234 | $25,177 | $6,473 | $18,704 |
| 2018 | $4,976 | $25,177 | $6,473 | $18,704 |
| 2017 | $4,373 | $23,679 | $5,696 | $17,983 |
| 2016 | $4,245 | $23,679 | $5,696 | $17,983 |
| 2015 | $3,861 | $23,679 | $5,696 | $17,983 |
| 2014 | $3,431 | $21,046 | $5,179 | $15,867 |
| 2013 | $3,352 | $21,046 | $5,179 | $15,867 |
Source: Public Records
Map
Nearby Homes
- 1822 N Mulligan Ave
- 1816 N Nashville Ave
- 2046 N Narragansett Ave
- 1631 N Natchez Ave
- 2151 N Natchez Ave
- 2207 N Nagle Ave
- 1813 N Mcvicker Ave
- 222 Le Moyne Pkwy
- 1116 N Elmwood Ave
- 2165 N Moody Ave
- 1625 N Oak Park Ave
- 1649 N Newcastle Ave
- 1220 N Euclid Ave
- 2146 N Mcvicker Ave
- 1711 N Austin Ave
- 2311 N Natchez Ave
- 1647 N Austin Ave
- 1047 Fair Oaks Ave
- 1220 N Oak Park Ave
- 1836 N New England Ave
- 1831 N Nagle Ave
- 1837 N Nagle Ave
- 1827 N Nagle Ave
- 1839 N Nagle Ave
- 1825 N Nagle Ave
- 1843 N Nagle Ave
- 1845 N Nagle Ave
- 1819 N Nagle Ave
- 1849 N Nagle Ave
- 1817 N Nagle Ave
- 1851 N Nagle Ave
- 1832 N Narragansett Ave
- 1830 N Narragansett Ave
- 1836 N Narragansett Ave
- 1828 N Narragansett Ave
- 1838 N Narragansett Ave
- 1826 N Narragansett Ave
- 1815 N Nagle Ave
- 1855 N Nagle Ave
Your Personal Tour Guide
Ask me questions while you tour the home.