
Seller's Agent in 2025
James Mattz
Keller Williams Preferred Rlty
(708) 798-1111
14 in this area
390 Total Sales
Estimated Value: $453,365
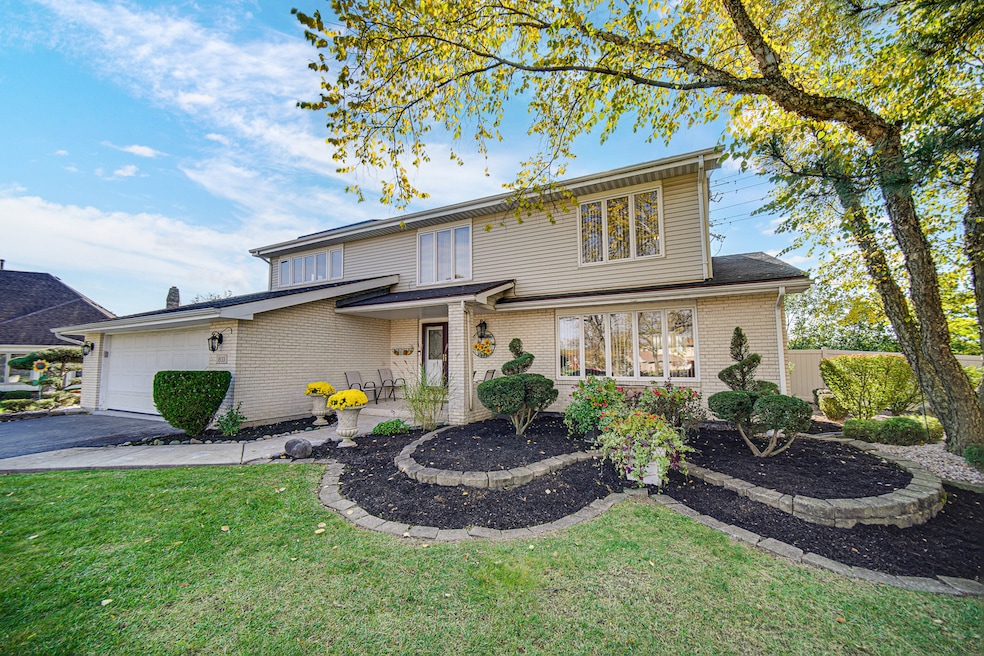
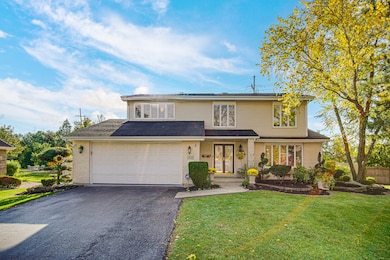
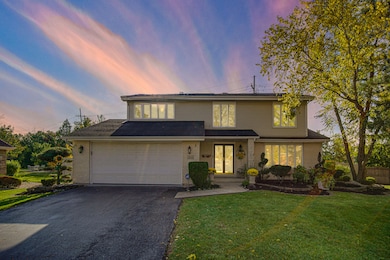
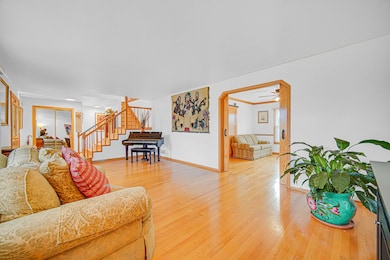
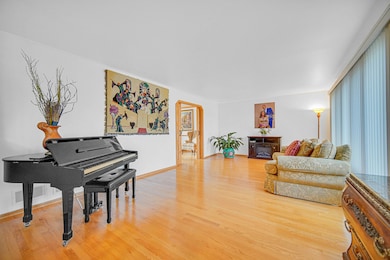
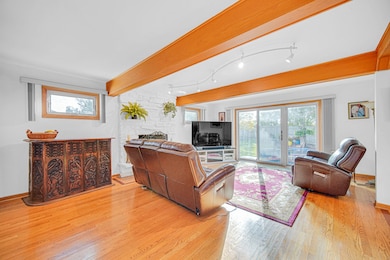
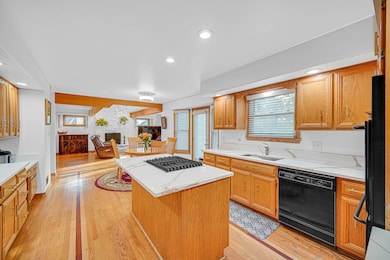
Nestled on a private cul-de-sac on nearly half an acre, this stunning 2-story home offers the perfect blend of comfort, elegance, and sustainability. Located just steps from award-winning Blue Ribbon schools, downtown Flossmoor shops, restaurants, and the Metra, this property delivers unmatched convenience and lifestyle. Inside, you'll find a beautifully appointed kitchen with oak cabinets, quartz countertops, built-in appliances, and a pantry closet. The inviting family room features a cozy fireplace and opens to a breathtaking fenced yard with a spacious patio-perfect for entertaining or relaxing outdoors. Retreat to the luxurious primary suite with a walk-in closet and spa-inspired bath with Jacuzzi, double bowl vanity, and separate shower. Upstairs, the oversized bedrooms offer plenty of space for family or guests. The finished basement provides a large recreational area and utility space with room for future expansion. Energy-efficient solar panels and a full solar backup power system provide peace of mind and savings. An incredible opportunity to own in one of Flossmoor's most sought-after neighborhoods-this one won't last! Schedule your showing today!
Last Agent to Sell the Property
Keller Williams Preferred Rlty License #471014052 Listed on: 11/05/2025
We collect this data history from publicly available records. To have your information removed, we recommend requesting removal directly through your county’s website.
| Date | Buyer | Sale Price | Title Company |
|---|---|---|---|
| Olowe Kizawanda | $460,000 | Lakeshore Title | |
| Gregory Sean | $220,500 | First American Title | |
| Western Financial Bank Fsb | -- | -- | |
| Hamzat Mopelola | $265,000 | Professional National Title |
We collect this data history from publicly available records. To have your information removed, we recommend requesting removal directly through your county’s website.
| Date | Status | Borrower | Loan Amount |
|---|---|---|---|
| Previous Owner | Olowe Kizawanda | $432,000 | |
| Previous Owner | Gregory Sean | $215,175 | |
| Previous Owner | Hamzat Mopelola | $210,500 | |
| Closed | Hamzat Mopelola | $28,000 |
| Date | Event | Price | List to Sale | Price per Sq Ft |
|---|---|---|---|---|
| 12/31/2025 12/31/25 | Sold | $460,000 | 0.0% | $147 / Sq Ft |
| 11/13/2025 11/13/25 | Pending | -- | -- | -- |
| 11/13/2025 11/13/25 | Off Market | $460,000 | -- | -- |
| 11/05/2025 11/05/25 | For Sale | $449,900 | -- | $144 / Sq Ft |
| Year | Tax Paid | Tax Assessment Tax Assessment Total Assessment is a certain percentage of the fair market value that is determined by local assessors to be the total taxable value of land and additions on the property. | Land | Improvement |
|---|---|---|---|---|
| 2025 | $11,506 | $33,000 | $7,250 | $25,750 |
| 2024 | $11,506 | $33,000 | $7,250 | $25,750 |
| 2023 | $10,856 | $33,000 | $7,250 | $25,750 |
| 2022 | $10,856 | $26,341 | $6,305 | $20,036 |
| 2021 | $10,963 | $26,340 | $6,304 | $20,036 |
| 2020 | $10,714 | $26,340 | $6,304 | $20,036 |
| 2019 | $8,898 | $22,684 | $5,674 | $17,010 |
| 2018 | $9,460 | $24,424 | $5,674 | $18,750 |
| 2017 | $10,718 | $24,424 | $5,674 | $18,750 |
| 2016 | $9,742 | $20,892 | $5,043 | $15,849 |
| 2015 | $9,722 | $20,892 | $5,043 | $15,849 |
| 2014 | $9,567 | $20,892 | $5,043 | $15,849 |
| 2013 | $11,117 | $25,896 | $5,043 | $20,853 |
Seller's Agent in 2025
James Mattz
Keller Williams Preferred Rlty
(708) 798-1111
14 in this area
390 Total Sales
Buyer's Agent in 2025
Rockeya Wilson
Berkshire Hathaway HomeServices Chicago
(773) 960-1807
1 in this area
16 Total Sales
Source: Midwest Real Estate Data (MRED)
MLS Number: 12510173
APN: 31-12-316-006-0000
Disclaimer: Certain information contained herein is derived from information provided by parties other than Homes.com. All information provided is deemed reliable, but is not guaranteed to be accurate and should be independently verified.
![]() All data is obtained from various sources and may not have been verified by broker or MLS GRID. Supplied Open House Information is subject to change without notice. All information should be independently reviewed and verified for accuracy. Properties may or may not be listed by the office/agent presenting the information. Some IDX listings have been excluded from this website.
All data is obtained from various sources and may not have been verified by broker or MLS GRID. Supplied Open House Information is subject to change without notice. All information should be independently reviewed and verified for accuracy. Properties may or may not be listed by the office/agent presenting the information. Some IDX listings have been excluded from this website.
Listings courtesy of Midwest Real Estate Data (MRED) as distributed by MLS GRID.
Based on information submitted to the MLS GRID
Ask me questions while you tour the home.